
Trinity University Trinity University
Digital Commons @ Trinity Digital Commons @ Trinity
School of Business Faculty Research School of Business
Fall 2020
A Longitudinal Analysis of Job Skills for Entry-Level Data Analysts A Longitudinal Analysis of Job Skills for Entry-Level Data Analysts
Tianxi Dong
Trinity University
, tdong@trinity.edu
J. Triche
Follow this and additional works at: https://digitalcommons.trinity.edu/busadmin_faculty
Part of the Business Administration, Management, and Operations Commons
Repository Citation Repository Citation
Dong, T., & Triche, J. (2020). A longitudinal analysis of job skills for entry-level data analysts.
Journal of
Information Systems Education, 31
(4), 312-326.
This Article is brought to you for free and open access by the School of Business at Digital Commons @ Trinity. It
has been accepted for inclusion in School of Business Faculty Research by an authorized administrator of Digital
Commons @ Trinity. For more information, please contact jcostanz@trinity.edu.

Journal of
Information
Systems
Education
Volume 31
Issue 4
Fall 2020
A Longitudinal Analysis of Job Skills for Entry-Level
Data Analysts
Tianxi Dong and Jason Triche
Recommended Citation: Dong, T. & Triche, J. (2020). A Longitudinal Analysis of Job Skills for
Entry-Level Data Analysts. Journal of Information Systems Education, 31(4), 312-326.
Article Link: http://jise.org/Volume31/n4/JISEv31n4p312.html
Initial Submission: 27 September 2019
Accepted: 27 March 2020
Abstract Posted Online: 8 September 2020
Published: 10 December 2020
Full terms and conditions of access and use, archived papers, submission instructions, a search tool,
and much more can be found on the JISE website: http://jise.org
ISSN: 2574-3872 (Online) 1055-3096 (Print)

A Longitudinal Analysis of Job Skills for Entry-Level Data
Analysts
Tianxi Dong
School of Business
Trinity University
San Antonio, TX 78212, USA
tianxi.dong@trinity.edu
Jason Triche
University of Montana
Missoula, MT 59801, USA
jason.triche@umontana.edu
ABSTRACT
The explosive growth of the data analytics field has continued over the past decade with no signs of slowing down. Given the fast
pace of technology changes and the need for IT professionals to constantly keep up with the field, it is important to analyze the job
skills and knowledge required in the data analyst and business intelligence (BI) analyst job market. In this research, we examine
over 9,000 job postings for entry-level data analytics jobs over five years (2014-2018). Using a text mining approach and a custom
text mining dictionary, we identify a preliminary set of analytic competencies sought in practice. Further, the longitudinal data also
demonstrates how these key skills have evolved over time. We find that the three biggest trends include proficiency with Python,
Tableau, and R. We also find that an increasing number of jobs emphasize data visualization. Some skills, like Microsoft Access,
SAP, and Cognos, declined in popularity over the time frame studied. Using the results of the study, universities can make informed
curriculum decisions, and instructors can decide what skills to teach based on industry needs. Our custom text mining dictionary
can be added to the growing literature and assist other researchers in this space.
Keywords: Business analytics, Business intelligence, Careers, Employment skills, Job skills, Text processing
1. INTRODUCTION
The explosive growth of the data analytics field has continued
over the past decade with no signs of slowing down. According
to CIO.com, the data analytics field included two of the top five
hot and high-paying tech skills in 2018 (Scorsone, 2018).
LinkedIn also published the top seven skills in high demand for
2019, and two of these seven skills were in a data analytics-
related field (Bila, 2018). IBM predicts that the demand for data
analysts will increase by 28% by 2020 (Columbus, 2017).
Besides the fact that the number of jobs greatly outpaces the
number of qualified candidates, there are other concerns in the
field. One of the major concerns is defining what exactly data
analysts do. The data analyst and business intelligence (BI)
analyst fields vary greatly, and professionals have a hard time
understanding the skills needed. In one study, Bowne-Anderson
(2018) spoke to over 30 data analysts and BI analysts across a
wide array of industries and academic disciplines to find out
what their jobs entail. One highlight of the interview suggests
that the ability to communicate the results of analytics is more
important than the ability to use sophisticated deep learning
models. Other results suggest that specialization is becoming
more important and that data ethics need to come from within
data science itself as well as from legislation, grassroots
movements, and other stakeholders.
Given the fast pace of technological changes and the need
for IT professionals to constantly keep up with the field, it is
important to analyze the job skills and knowledge required in
the data analyst and BI analyst job market. Because the field
changes so rapidly, it is also just as important to understand
what data analyst and BI analyst skills are trending upward as
well as trending downward over time. Currently, only a few
studies (Deng, Li, and Galliers, 2016; Luo, 2016) have
attempted to address these concerns and have not fully explored
the changing trends. To address this gap, we seek to answer the
following questions:
1. What data analyst job skills and knowledge remained
steady from 2014-2018?
2. What data analyst job skills were popular in the past,
but are less attractive now?
Journal of Information Systems Education, Vol. 31(4) Fall 2020
312
3. W
hat data analyst job skills are gaining attention in the
current job market?
This study focuses on the job postings for entry-level hires
into the fields of data analyst and BI analyst. We define entry-
level hires as individuals who are completing their
undergraduate degree and wish to start a career in data and/or
BI analytics. Entry-level hires could also include individuals
who have an undergraduate degree in a field other than
business, math, or computer science or individuals who are
working in a non-analyst field and looking to change careers to
pursue a career in data and/or BI analytics. According to
GlassDoor, the data analyst job is one of the nine perfect jobs
for career changers (Moore, 2018). Our study explores the job
skills and knowledge for data analyst and BI analyst jobs on a
large scale. Using text analysis, we analyze approximately
9,000 entry-level job postings from Indeed.com in the data
analyst and BI analyst field from 2014 to 2018.
The results of this study have several practical
contributions. First, as undergraduates start to define their
career aspirations in their last years of college, these findings
can help focus their skills. Students can start choosing electives
that strengthen certain skills that are in hot demand in the
current data and BI analyst job market. Second, the results of
this research can also assist those individuals who want to
change their current career to an entry-level data or BI analyst
role. Those individuals can start pursuing professional training,
university certificates, or online courses that can teach the skills
that are in hot demand in this market. Third, these findings can
help undergraduate programs and professional training
companies focus their course offerings to align with the latest
skills in this rapidly changing job market. Lastly, the results of
this research can help companies retool and train their
employees on the latest data and BI analyst skill sets to stay
competitive in a data-driven business ecosystem.
2. LITERATURE REVIEW
2.1 Data Science, Data Analytics, and Business Intelligence
The concepts of data science, data analytics, and business
intelligence are not new. One of the founding disciplines,
statistics, has been around since the mid-1700s. Mathematicians
have been building models for centuries, and even basic
database concepts have been around since the 1960s.
Companies have been analyzing data to improve consumer
interaction, make production more efficient, and reduce cost
since the middle of the 20th century (Mills, Chudoba, and
Olsen, 2016). However, there has been explosive growth in
these fields over the past decade. Mills, Chudoba, and Olsen
(2016) have attributed this growth to three trends. The first
trend is enhanced technology infrastructure that can handle
terabytes of data in real time (Silva et al., 2014). The second
trend is the advancement of data storage and transformation.
The third trend is the expansion of analytical tools and
techniques (Chen, Chiang, and Storey, 2012; Davenport, Barth,
and Bean, 2012). These three trends have allowed the field to
expand from its established foundations.
The terms data science, data analytics, business
intelligence, and big data are used throughout the literature, but
it is helpful to define these terms. Data science is a field that
finds value in data and uses this value to create additional data
products (Loukides, 2011). Davenport and Patil (2012) define a
data scientist as a combination of a data hacker, analyst,
communicator, and trusted adviser.
Data analytics refers to the process of inspecting, cleaning,
transforming, and modeling data with the goal of supporting
decision-making (Lewis-Beck, 1995). Business analytics is a
subfield of data analytics that refers to problem recognition and
problem solving that happens within the context of business
situations (Holsapple, Lee-Post, and Pakath, 2014). In one
study, Turel and Kapoor (2016) examined the gap between
business school curricula and presumed industry needs in
business analytics. They identified business analytics courses
as those that cover topics such as “business intelligence, data
visualization, big data, and their roles in business strategy and
in improving business performance” (p. 99).
The Gartner Group introduced the term business
intelligence in 1989, describing a set of concepts and methods
to improve business decision making by using fact-based
support systems (Power, 2007). Expanding on this definition,
business intelligence is a broad category of applications,
technologies, architectures, and processes for gathering,
storing, accessing, and analyzing operational data to provide
business users with timely competitive information to enable
better insights for operational and strategic decision making
(Gupta, Goul, and Dinter, 2015).
The term big data is more than just a large amount of data;
it also includes the tools and procedures used to manipulate and
analyze the data (Burkholder, 1992). Big data is driving
changes in what types of data are being collected, how often
data are collected, and how much data are being collected
(Gardiner et al., 2018). Big data also has the ability to analyze
varied datasets with respect to variety (structured and
unstructured data), volume (amount of data), and velocity
(archival versus streaming data).
To help clarify the distinction between the terms data
science and data analytics, Aasheim et al. (2015) examined a
small sample of undergraduate programs in the U.S. Some
programs called themselves data science programs and some
called themselves data analytics programs. They found that
there are similarities between the two differently named
programs. These similarities include an increase in the number
of courses on statistics, data management, data mining, data
visualization, and other modeling techniques. They also found
several differences between the programs. Mainly, data science
programs were interdisciplinary in nature and required
additional math (at least through linear algebra), programming,
and statistics courses, whereas analytics programs covered data
warehousing and were mainly located in the business school.
These data science characteristics align with the definition of
data science as defined above by Loukides (2011) and
Davenport and Patil (2012).
As far as the current job market, ac
cording to a report from
Burning Glass Technologies, Business-Higher Education
Forum, and IBM, the fields of data-driven decision makers,
functional analysts, data analysts, and analytical managers all
had double-digit projected job growth over the next five years
(Miller and Hughes, 2017). Another report by PWC estimated
that by 2021, only 23% of educators stated that graduates would
have BI&A skills, while 69% of the employers prefer job
candidates with those skillsets (PWC, 2017).
Journal of Information Systems Education, Vol. 31(4) Fall 2020
313
2.2 Skills, Knowledge, and Abilities
Since we are analyzing each job posting in its entirety, there are
several different categories to examine. These categories
include skills, knowledge, and abilities. Skills are competencies
developed through training or experience, knowledge is the
theoretical or practical understanding of a subject, and abilities
are the talents involved in being able to do something (Lauby,
2013).
There are two similar studies that investigate the business
analytics job market. In one of the studies, Deng, Li, and
Galliers (2016) investigated the skills, knowledge, and abilities
that employers required for a business analytics role. In
addition, they analyzed the job postings by business degree
versus non-business degrees (i.e., computing, engineering,
statistics, or mathematics). Using Latent Semantic Analysis,
Deng, Li, and Galliers analyzed 71 unique job postings from
LinkedIn. They discovered that the postings were split fairly
evenly between business and non-business degrees and that the
top two industries looking for employees were healthcare and
information technology services. In addition to their findings,
the researchers mapped the required skills to Bloom’s
taxonomy (Bloom, 1956) to help institutions align course
design with student learning objectives.
The other similar study analyzed 1,216 job advertisements
from Indeed.com that contained the word “big data” in the job
title (Gardiner et al., 2018). Using the pile-sort methodology,
they found two major insights. The first insight was that a
number of job postings emphasized the design and development
of analytical systems. The second insight was that soft skills
still remain very important in job postings, even given the
demand for skills in new and emerging technologies. In
addition to these insights, the authors created a Big Data
Discipline Skills Conceptual Model. This model highlights and
provides insight into the complexity of the big data discipline.
It is worth noting that we found it difficult to differentiate
between skills and abilities. Given the definition that skills are
competencies and abilities are talents, it is hard to determine the
difference with static job postings. For example, is a job posting
asking for an applicant to generate data mappings a skill or an
ability? For our purposes, the category does not matter, as it is
mandated by the employer. Therefore, we followed Gardiner et
al. (2018) in combining the terms skills and abilities into one
term, which we will refer to as skills. We further break down
skills into two groups. The first group is higher-level general
domain skills (e.g., business intelligence and statistics), and the
second group is specific software skills (e.g., SAP and R). We
refer to knowledge as the academic background needed for the
job posting (i.e., high school, bachelor’s degree, master’s
degree, or doctoral degree).
2.3 Prior Relevant Studies
Another study closely related to our research is a study of the
requirements needed for entry-level analytics professionals.
Luo (2016) examined job ads posted on three major sites
(LinkedIn, Monster.com, and Indeed.com) over a six-month
period. After analyzing 924 job postings, the author concluded
that companies expected entry-level professionals to be able to
work in teams and work with databases and spreadsheets. The
study also found that data mining, optimization, and other
advanced analytical methods were rarely listed in postings for
entry-level positions.
A related study took a broader approach by examining
trends in required job skills for IT professionals from 1988 to
2003 (Gallivan, Truex, and Kvasny, 2004). The researchers
performed content analysis on 17 years of samples from the job
ads section of Computerworld and the Sunday classified job ads
section of a major metropolitan newspaper. Their goals were to
1) determine the most dramatic trends for IT positions, 2)
determine the most dramatic trends for required skills, and 3)
prove the forecasts offered by researchers in earlier studies were
accurate. They found that most of their results were consistent
with previous forecasts. For example, employers were asking
for an ever-increasing number and variety of skill sets from new
hires, and programming and software development skills
remained important. They also discovered that although
employers emphasized the need for well-rounded individuals
and strong soft skills, the job postings prioritized hard skills.
Using a web content data mining application, one study
(Aken et al., 2010) examined approximately a quarter-million
unique IT job descriptions. Using cluster analysis, they
condensed job postings from various job search engines into 20
different job skill clusters. At the time of publication, the top
five job skill clusters were IT managers, security specialists,
project analysts/managers, system administrators, and database
developers. Aasheim et al., (2012) presented an extension to
two previous studies (Aasheim, Li, and Williams, 2009;
Aasheim, Williams, and Butler, 2009) in which they examined
knowledge and skill requirements for entry-level IT employees.
Using a survey and a basic z-test, they discovered that the top
skills needed by employers were personal and interpersonal
skills, with honesty and integrity ranked most highly.
Text analyses of job postings ha
ve been performed in other
business- and information-related fields. In the field of
information science, one research project examined job
descriptions and advertisements for three data curation-focused
positions (Lyon et al., 2015). Their goals were to 1) discover
what skills were required for data science roles, 2) map data
science roles to current curriculum topics and course offerings,
and 3) develop new collaborations and partnerships in the data
science curriculum. Using job postings from Indeed.com from
January 2014 to April 2015, the researchers examined postings
in the fields of data librarian, data curator, and data archivist.
Among other findings, the research demonstrated that
employers were seeking data-savvy graduates who were work-
ready.
Another study in the field of marketing used content
analysis to examine 500 marketing job postings ranging from
entry-level all the way to senior-level positions (Schlee and
Harich, 2010). Not surprisingly, they found that there were
considerable differences in the skills and knowledge required
for all different levels of marketing jobs. They also discovered
that technical skills appeared to be much more important than
what had been documented in earlier marketing research.
In summary, there are several studies that examine the data
analytics job market. Our study differs from these previous
studies in several ways. First, we examine a longer time frame
(i.e., five years) compared to only several months (e.g., Luo,
2016; Gardiner et al., 2018). We also analyze about 9,000 job
postings compared to other studies that only analyzed about
1,000 job postings (e.g., Luo, 2016; Gardiner et al., 2018).
Lastly, we use several terms to search for job postings
compared to a specific search term like “big data” (Gardiner et
Journal of Information Systems Education, Vol. 31(4) Fall 2020
314
a
l., 2018), “BA positions” (Deng, Li, and Galliers, 2016), or
“data analyst” (Luo, 2016).
3. METHODOLOGY
In this study, we use a text mining approach to systematically
analyze job postings to identify the skills and knowledge
expected for entry-level data analyst positions. We follow the
established protocols in previous IS research (Mudambi and
Schuff, 2010; Wang, Kannan, and Ulmer, 2013) for data
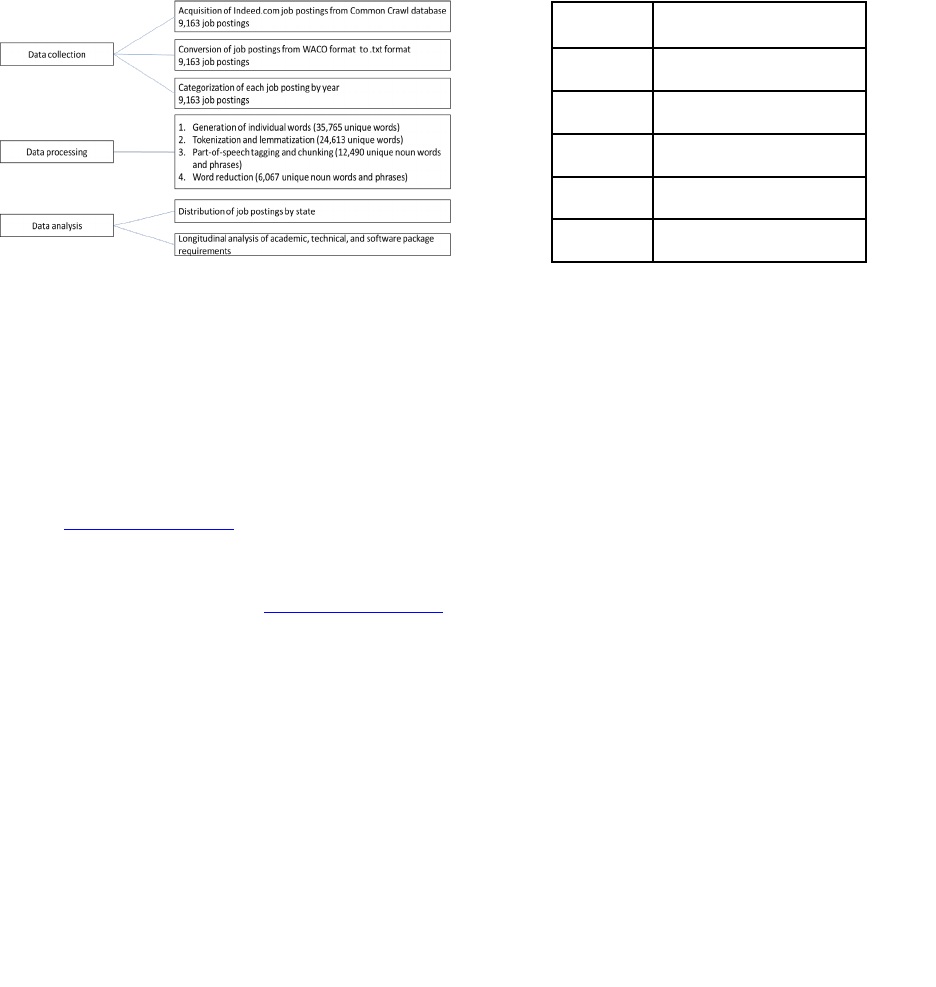
collection and text mining analysis. Figure 1 provides an
overview of the data collection, processing, and major analyses
for this study.
Figure 1. Data Collection, Processing, and Analysis
3.1. Data Collection
3.1.1 Data source. We started by examining job postings on
Monster.com, Indeed.com, and LinkedIn.com. We discovered
that all three job posting sites shared mostly the same job
postings. Therefore, we decided to focus our search on just one
of the job posting websites to avoid duplication. In 2010,
Indeed.com passed Monster.com to become the highest-traffic
job website in the United States. Currently, Indeed.com boasts
that they have over 3 million companies with 250 million job
seekers (http://www.Indeed.com
).
Our first challenge was how to collect job postings over
past years because job websites do not keep historical data for
more than one year. Therefore, we used the Common Crawl
dataset to address this problem (http://commoncrawl.org/
).
Common Crawl is a non-profit organization that builds and
maintains an open repository of web crawl data that is, in
essence, a copy of the Internet. Common Crawl data contains
over 25 billion web pages (Batikas, Claussen, and Peukert,
2018) and is widely used in hundreds of research projects
(Batikas, Claussen, and Peukert, 2018; Cafarella et al., 2018).
Since we were only interested in the content from Indeed.com,
we only examined a very small fraction of the Common Crawl
corpus.
3.1.2 Search terms. A key component of any text analysis is to
first define the search terms to be used. We examined previous
studies (Sodhi and Son, 2009; Liberatore and Luo, 2013; Deng,
Li, and Galliers, 2016; Luo, 2016) to determine key search
terms. We used a wildcard search of business analy*, data
analy*, and business int*. These wildcard searches returned the
following results: data analyst, data analytics associate, data
analysis, business intelligence analyst, and business analytics.
The scope of this research is examining entry-level
positions. During our initial search process, we used the search
term “data scientist” (technically, we used a wildcard search of
data sc*). After examining a random sample of the job postings
returned, we discovered that these job postings required at
minimum a bachelor’s degree plus at least a few years of work
experience in the data analytics field. We considered these not
to be entry-level positions and out of the scope of our research.
Therefore, we excluded the terms data scientist, data science
associate, and data science analyst from our search terms. The
total number of job postings downloaded from Common Crawl
for each year from 2014 through 2018 that fit our search criteria
is listed in Table 1
.
Year
Number of Job Postings
2014
1722
2015
1955
2016
1735
2017
1888
2018
1863
Table 1. Number of Job Postings by Year
3.2. Data Processing
In order to accurately and automatically acquire job skill
content from large-scale texts, natural language processing
(NLP) techniques must be introduced (Jurafsky and Martin,
2008). According to research in computational linguistics
(Church, 1988) and our observations of the words describing
job skills in the job postings, the main job skill information
comes from nouns. Therefore, verbs, adjectives, and
prepositions could be safely removed without losing the main
information. We applied part-of-speech tagging to filter the
nouns for further analysis.
The data processing can be broken down into the following
steps:
1. Convert 9,163 job postings to individual words. These
job postings have a total of 4,499,672 words and 35,765
unique words.
2. Normalize/tokenize words. By applying lemmatization,
total words and unique words are reduced to 2,867,392
and 24,613, respectively.
3. Apply part-of-speech (POS) tagging and chunking.
There are 12,490 unique noun words and phrases
remaining.
4. Remove rare or common nouns and noun phrases. Any
nouns and noun phrases that appear in fewer than 1%
or more than 75% of the job postings are removed. The
number of unique noun words and phrases is further
reduced to 6,067. With 6,067 unique nouns and noun
phrases left, it is feasible for us to manually analyze the
key words that are relevant to data analyst job skills.
3.2.1 Part-of-speech tagging (POS). Part-of-speech tagging is
a process of assigning morphological tags or categories
Journal of Information Systems Education, Vol. 31(4) Fall 2020
315

(classes) to each token (Voutilainen, 2003). Commonly, in the
context of NLP, a token is preferred, rather than a word, because
each token has a unique meaning. After POS tagging is applied,
the tokens in a sentence are marked into proper classes. In this
research, the Stanford Log-linear Part-Of-Speech Tagger,
which was developed by the NLP group at Stanford University,
has been adopted. The Stanford Log-linear Part-Of-Speech
Tagger is considered the most widely used POS tagger, as this
tagging system can achieve more than 95% accuracy in English
tagging (Toutanova and Manning, 2000).
3.2.2 Chunking. It is not uncommon that single noun tokens
can fail to represent some job skills, such as interpersonal skills
(adj + noun) or Microsoft Office (noun + noun). In NLP, these
short phrases are identified as noun phrases (NP). It is more
appropriate to consider these NPs combined as a noun token,
rather than separate tokens. Chunking addresses these issues.
Chunking is a process of extracting phrases from text data.
Therefore, in addition to using part-of-speech tagging,
chunking is also applied to extract NP. Tokens that follow the
grammatical patterns described below are extracted for further
analysis:
1. noun, for example, Python, R, Excel, Tableau
2. noun + noun, for example, Microsoft Office,
management software, data visualization
3. gerund + noun, for example, programming skills,
writing skills
4. adjective + noun, for example, interpersonal skills,
analytic capability
3.2.3 Dictionary development. A key step in text mining
involves creating or using an existing dictionary of relevant
words in order to categorize and classify the search results.
Because there is sparse research in this area and the field is
constantly evolving, we did not have an exhaustive dictionary
to reference. Therefore, we built our own dictionary. There are
two ways to build a dictionary from scratch – a theoretical
approach and an empirical approach (Luo, 2016).
The theoretical approach involves using existing terms in
relevant literature. We started by examining literature that has
used a text mining approach to identify job skills in business
analytics (Deng, Li, and Galliers, 2016) and operational
research skills (Sodhi and Son, 2009). Starting with a list of 367
words, two expert coders in the field of data analytics agreed on
a final list of 149 words that are relevant to the data analytics
field. We started our dictionary with these 149 words. The
Kappa interrater reliability was 0.984, which is above the well-
established mark of .70 according to Landis and Koch (1977)
and Bowers and Courtright (1984). Coding disagreements were
discussed, and eventually a consensus was reached.
Although these 149 words were a good starting point, at
first glance they did not fully reflect the current job market of
the data analytics field. For example, the programming
language Python was not included in the original list although
it is a very popular programming language in the field.
Therefore, we used an empirical approach to update our
dictionary. An empirical approach involves deriving words
from a large sample of representative job ads (Sodhi and Son,
2009). Using the original corpus of job postings from
Indeed.com, we identified 6,067 single words. A vast majority
of these words were not relevant since they included every word
in a job posting. For example, the words “position,” “user,” and
“education” were not useful in our dictionary. The same two
coders agreed on a final list of 40 words to add to the dictionary.
New additions to the dictionary included words like “Python,”
“R,” and “Pentaho,” which are all relevant to the data analytics
field. The Kappa interrater reliability was 0.956, new coding
disagreements were discussed, and a consensus was reached.
Finally, similar concepts were merged and grouped into three
primary categories: general domain skills, software skills, and
knowledge. This process led to a dictionary containing three
primary categories with 14 sub-categories and 186 keywords
and phrases. The final dictionary is reported in Appendix A.
3.3 Statistical Analyses
In order to answer our research questions to determine if there
were significant differences in the skillsets between 2014 and
2018, we tested the difference between two population
proportions. The test statistic for measuring the difference
between two population proportions is:
where,
Longitudinal studies normally use some type of regression.
In our case, we did not have any variance within the year;
consequently, we could not get a standard error. Therefore,
regression would not work with our dataset. We also explored
a non-parametric test (i.e., MannKendall) to analyze the trend
each year. The MannKendall test examines the trend year over
year to determine if the trend is significant over the time period.
However, the minimum number of recommended
measurements for the MannKendall is at least 8-10 data points
(Khambhammettu, 2005). In our case, we only had five years
of data, resulting in only five measurements per job skill item.
This would result in inaccurate or biased results using a
MannKendall test. Therefore, the proportion test was the most
appropriate analytical method for our dataset.
4. RESULTS
This section displays the results of our analysis. Due to the large
number of keywords analyzed, only significant trends and the
most popular general domain skills, software skills, and
knowledge areas are displayed in this section. All results
(including non-statistically significant trends or less popular
skills and knowledge) are reported in Appendix B.
4.1 Analysis by U.S. State
First, we analyzed the results by U.S. state. The top five states
in 2018 with the highest number of data analyst jobs, in order,
were Virginia, Texas, California, New York, and Illinois. This
is not surprising given that three of the top five states in this list
are the largest states by population. Because the largest states
Journal of Information Systems Education, Vol. 31(4) Fall 2020
316
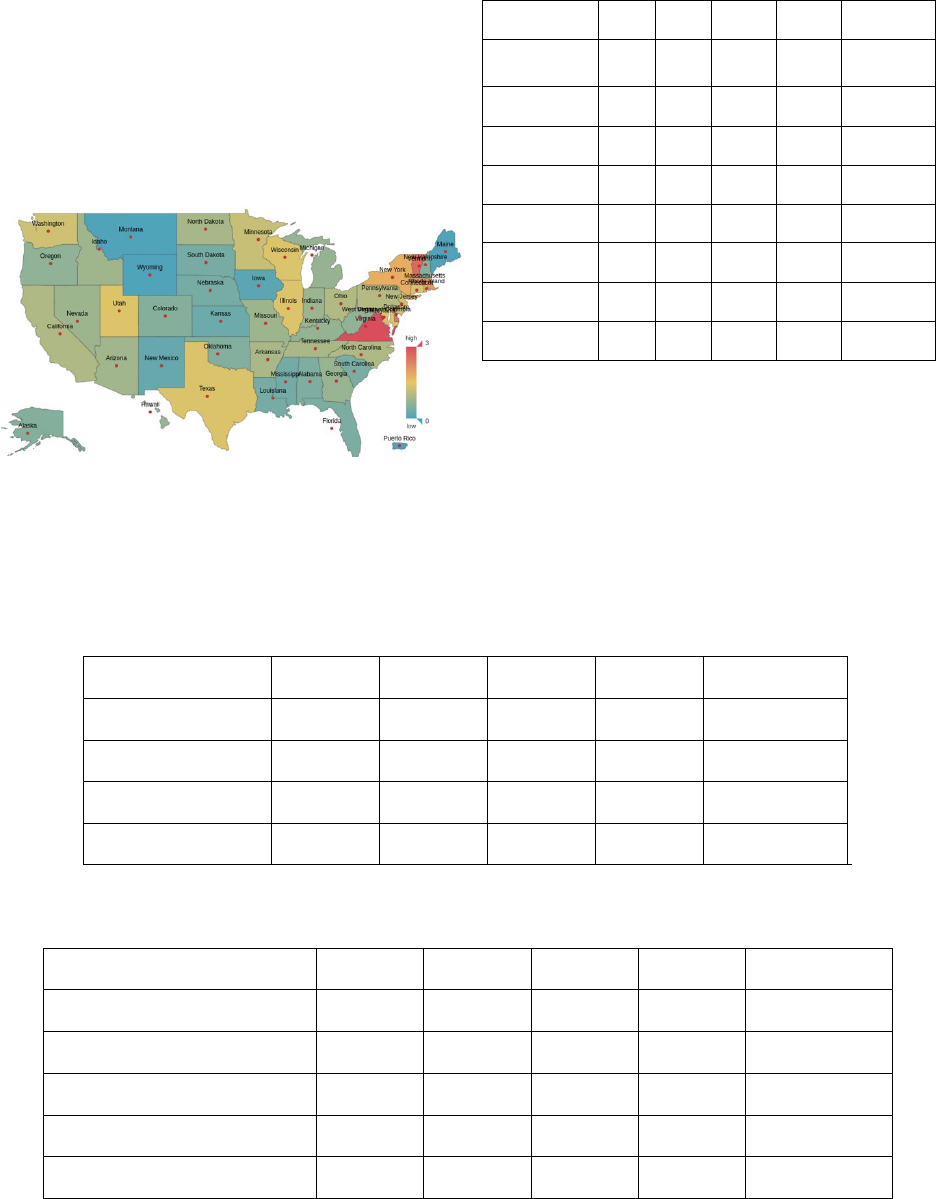
b
y population would have the largest number of job postings,
we standardized by dividing the total number of job postings by
the number of businesses in that state. We collected the number
of businesses in each state using the NAICS Association
website (NAICS, 2019). The top five states with the
standardized job postings, in order, were District of Columbia
(not a U.S. state), Virginia, Vermont, Delaware, and
Massachusetts. Figure 2 illustrates a heat map for the number
of standardized data analytics jobs in 2018.
Figure 2. Average Job Postings by State
Table 2 displays the percentage of job postings (job
postings in that state/job postings in the U.S.) by state for only
states that have a significant difference between 2014 and 2018.
States
2014
2015
2016
2017
2018
Virginia
9.36%
7.92%
11.92%
13.80%
18.00%***
Texas
7.02%
9.06%
8.16%
6.48%
10.20%***
New York
6.30%
7.44%
6.08%
5.10%
9.00%**
Massachusetts
2.52%
3.90%
4.48%
3.36%
4.08%**
Ohio
3.96%
3.30%
2.00%
2.58%
2.76%*
Washington
4.23%
2.34%
2.88%
2.40%
2.40%**
Maryland
3.24%
2.58%
3.84%
2.58%
2.28%*
Georgia
3.87%
3.78%
3.12%
1.80%
2.04%***
Table 2. Distribution of Data Analyst Job by U.S. State
*p < 0.05, **p < 0.01, ***p < 0.001
4.2 Evolution of Knowledge Required
Table 3 displays the percentages of job postings that required
bachelor’s, master’s, MBA, or Ph.D. degrees. Other kinds of
academic degrees (e.g., associate degree and high school
diploma) are not reported, as the percentages are below 1%,
which means few jobs required less than a bachelor’s degree
4.3 Evolution of General Domain Skills
Table 4 displays the percentages of job postings that required
general domain skills by year.
Knowledge Required
2014
2015
2016
2017
2018
Bachelor
60.60%
60.70%
62.30%
64.80%
70.30%***
Master
12.90%
12.10%
14.30%
15.90%
15.30%*
MBA
6.00%
4.10%
4.10%
5.00%
4.60%*
Ph.D.
3.70%
3.80%
4.40%
4.40%
5.60%**
Table 3. Evolution of Academic Requirements for Data Analysts
*p < 0.05, **p < 0.01, ***p < 0.001
Categories
2014
2015
2016
2017
2018
General Analytics
69.30%
69.70%
69.00%
71.60%
69.90%
General Statistics
22.30%
19.80%
23.00%
29.10%
28.20%***
Modeling
17.20%
15.90%
17.90%
20.30%
21.00%**
Model Development
21.30%
21.10%
22.80%
24.70%
25.70%***
Data Management
40.00%
41.20%
44.50%
50.30%
49.80%***
Table 4. Evolution of General Domain Skills for Data Analysts
*p < 0.05, **p < 0.01, ***p < 0.001
Journal of Information Systems Education, Vol. 31(4) Fall 2020
317

Software Skills
2014
2015
2016
2017
2018
Database System
48.00%
48.80%
52.40%
58.10%
58.90%***
SQL Server
10.40%
12.10%
13.40%
15.20%
17.80%***
Oracle
15.00%
14.00%
13.40%
14.40%
15.50%
Microsoft Access
13.60%
11.60%
11.30%
11.60%
10.40%**
NoSQL
0.70%
1.00%
1.60%
1.50%
1.60%**
DBMS
0.30%
0.60%
0.60%
0.90%
0.90%*
Personal Productivity
30.70%
29.70%
32.60%
32.10%
28.60%
Microsoft Office
18.40%
16.30%
20.60%
18.50%
17.20%
Microsoft PowerPoint
12.10%
13.70%
13.70%
14.20%
13.90%
Business Intelligence
11.30%
12.60%
17.60%
21.80%
23.20%***
Tableau
5.30%
8.30%
13.20%
18.20%
18.90%***
Cognos
7.50%
5.30%
5.30%
5.80%
6.00%*
Power BI
0.10%
0.10%
1.00%
1.60%
1.90%***
Programming Language
16.00%
16.40%
20.20%
21.90%
22.50%***
Python
2.30%
3.30%
6.60%
9.10%
10.70%***
Pig
0.30%
0.50%
0.70%
0.60%
1.00%**
Enterprise System
16.00%
15.80%
16.20%
18.50%
20.30%***
SAP
10.40%
9.00%
8.00%
8.40%
8.30%*
Hadoop
2.00%
2.40%
4.00%
4.50%
5.10%***
Salesforce
3.40%
4.50%
2.80%
4.50%
4.90%*
Azure
0.20%
0.00%
0.80%
1.30%
3.60%***
Hive
0.70%
1.10%
1.80%
1.80%
2.10%***
Google Analytics
0.50%
0.50%
1.50%
1.00%
1.20%*
Statistical Package
10.10%
9.50%
12.40%
15.40%
16.10%***
R
4.50%
4.40%
7.00%
9.60%
11.80%***
SAS
6.60%
6.60%
8.00%
8.80%
9.70%***
SPSS
1.60%
1.90%
2.40%
3.70%
2.50%*
Table 5. Evolution of Software Skills for Data Analysts
*p < 0.05, **p < 0.01, ***p < 0.001
Categories are underlined; subcategories are indented. Bold (italicized) text indicates a positive (negative) trend between
2014 and 2018.
Journal of Information Systems Education, Vol. 31(4) Fall 2020
318

4.4 Evolution of Software Skills
Table 5 displays the percentages of job postings that required
software skills by year. The software skills are sorted by the
most popular software skills in 2018 within each category. Only
significant trends (i.e., those software skills that significantly
increased or decreased from 2014 to 2018) or software that
appeared in at least 10% of the job postings are displayed in
Table 5. Categories are underlined and subcategories are
indented. Bolded (italicized) software skills indicate a
significant increase (decrease) between 2014 and 2018. All
results are presented in Appendix B.
5. DISCUSSION
5.1 Discussion by Research Question
We will discuss the results in terms of the research questions.
Although the U.S. state analysis was not a research question, it
is important to know how data analyst jobs are distributed by
U.S. state. According to Table 2, Virginia increased from
9.36% of U.S. job postings in 2014 to 18% of U.S. job postings
in 2018. Virginia is the leading data center market in the U.S.
and has the 3rd-highest concentration of high-tech workers in
the nation. Virginia is “preparing for future growth for IT
companies through its top-ranked higher education system to
build a pipeline of technology talent” (Key Industries, n.d.). The
number of job postings in Texas increased gradually each year
as well. Several data centers were established in Texas recently,
such as Microsoft and RackSpace. These data centers are
developing rapidly, contributing to the increasing job demand
in Texas (Mosbrucker, 2018). It is also interesting to note that
several states showed declining percentages of job postings
from 2014 to 2018. For example, Ohio, Washington, Maryland,
and Georgia all show statistically significant decline over time,
although not a large number in magnitude.
The first research question is, “What data analyst job skills
and knowledge have remained steady from 2014 to
2018?” According to Table 4, general statistics has remained a
steady and highly desired skill over the time period studied. In
terms of software skills (see Table 5), Personal Productivity
Software (e.g., Visio, JIRA), Microsoft Office (not including
Access), and Oracle have remained steady and highly desired
during the time frame of the study. Other software or languages
that has remained steady, although not appearing in a large
percentage of job postings, include XML, Teradata, DB2,
MySQL, Linux, Visual Basic, and HTML. These general
domain skills and software skills have been steady for the past
several years and have been documented in other studies (e.g.,
Gallivan, Truex, and Kvasny, 2004; Luo, 2016).
The second research question is, “What data analyst job
skills were popular in the past, but are less attractive
now?” None of the general domain skills (see Table 4) showed
any decline from 2014-2018. In terms of software skills (see
Table 5), only Microsoft Access (p < 0.01), Cognos (p < 0.05),
and SAP (p < 0.05) showed statistically significant decline. In
terms of Microsoft Access, this may be due to direct
competition from other growing, open-source database
software like MySQL. There is some anecdotal evidence that
Microsoft Access customer support threads have been declining
(Microsoft, 2017). Cognos is an IBM business intelligence suite
that provides a toolset for reporting, analytics, scorecarding,
and monitoring of events and metrics. Although showing
decline, the suite is still solid at 6.00% of job postings in 2018.
SAP is an enterprise-wide software that helps manage
operations and customers. SAP also has BI software including
the BI suite, SAP Lumira, Hana, and Crystal Reports. Again,
although SAP has shown a statistically significant decrease
from 2014 to 2018, it is still a sought-after software skill at 8.3%
of job postings in 2018. In summary, three software skills
showed statistically significant decline, but these three software
packages are still desired skills in the market.
The third research question is, “What data analyst job skills
are gaining attention in the current job market?” There are
numerous upward-trending general domain skills and software
skills over 2014-2018. First, we will examine the upward-
trending skills that are in the top 25% of all job postings. The
percentages indicate the number of job postings requiring that
skill in 2018. General statistics (28%, p < 0.001), modeling
(21%, p < 0.01), model development (26%, p < 0.001), data
management (50%, p < 0.001), database systems (59%,
p < 0.001), BI (23%, p < 0.001), programming languages (23%,
p < 0.001), and enterprise systems (21%, p < 0.001) all
increased significantly from 2014 to 2018 and are highly
desired skills. In terms of software skills or languages, SQL
server (18%, p < 0.001), Tableau (19%, p < 0.001), statistical
packages (16%, p < 0.001), SAS (10%, p < 0.001), R (12%, p
< 0.001), and Python (11%, p < 0.001) are all in the top quartile
in terms of job postings and show a statistically significant
increase.
The next set of general domain skills and software packages
are increasing in demand over time but represent the next
quartile (top 50% of job postings). These software packages
include SPSS (3%, p < 0.05), Hive (2%, p < 0.001), Salesforce
(5%, p < 0.05), Hadoop (5%, p < 0.001), and Microsoft Azure
(4%, p < 0.001). Although demand for these skills grew during
this time frame, they do not represent the top quartile in terms
of the number of entry-level job postings asking for that
skillset.
Lastly, the skills that grew between 2014 and 2018 but
represent the lower 50% of the total entry-level job postings
include NoSQL (1.6%, p < 0.01), Microsoft Power BI (1.9%, p
< 0.001), Apache Pig (1%, p < 0.01), and Google Analytics
(1.2%, p < 0.05). An interesting observation is the lack of job
postings that mention NoSQL. NoSQL is a non-relational
database that is scaled horizontally and means “not only SQL.”
Only a small fraction of job postings mentioned NoSQL, which
indicates that NoSQL has not increased in popularity as
previously predicted (Pal, 2016). This is useful information for
instructors of database courses. If time is limited, instructors
should focus on relational databases instead of NoSQL since it
is not highly demanded in the industry.
There are several other software packages that are not
trending up or down (i.e, remained steady from 2014-2018) but
only represent a very small fraction of entry-level job postings.
For example, MongoDB (0.3%), Apache HBase (0.6%),
Apache Cassandra (0.2%), Pentaho (0.3%), JavaScript
visualization library – D3 (0.2%), STATA (0.5%), Ruby
(0.3%), and IBM Watson (0.2%) only appear in a small fraction
of job postings. Some of these software programs are taught in
database, analytics, and BI courses and are widely known in the
industry. However, the results of this research demonstrate that
they are not a widely needed skillset for entry-level data
analytics jobs. Therefore, given the time constraints of a course,
Journal of Information Systems Education, Vol. 31(4) Fall 2020
319
i
nstructors can leave these software packages out of the lesson
plan.
Lastly, the top three software and languages that grew the
fastest and are mentioned in at least 5% of the job postings in
2018, in order, include Python (11%), Tableau (19%), and R
(12%). These are widely used software and languages in
industry and are taught across the world in statistics, computer
science, and business intelligence courses. As of 2019, these are
highly sought-after skills and should remain part of the
curriculum in training programs and universities.
Other observations from the analysis include:
1. An increasing number of jobs require candidates to
have some programming skills, such as Python and R.
2. An increasing number of jobs emphasize data
visualization, which requires proficiency with software
like Tableau.
3. A large number of jobs require at least a bachelor's
degree (70%).
For data analysts, being familiar with interpreted
programming languages like Python and R is a prerequisite, as
programming is an inherent part of data processing. Data
visualization is the graphical representation of information and
data. By using visual elements like charts, graphs, and maps,
data visualization tools provide an accessible way to see and
understand trends, outliers, and patterns in data.
5.2 Contribution
This research provides a practical contribution for several
different audiences. First, universities can use these results to
help inform curriculum decisions. For example, the increasing
need for programming languages, data visualization, and
database skills is imperative. Second, instructors in an analytics
course can use these results to decide what technical and
software skills should be taught. As mentioned before, if time
is constrained, instructors could drop tools like Pentaho and
MongoDB. Third, this research is useful for companies that
provide business technology training. These training centers
can retool their offerings to match industry trends in skillsets
and software skills. Lastly, this research can help individuals
who are looking to change careers to data analytics. By
understanding the trending general domain skills and software
skills, individuals can start learning the most desired skills in
order to transition careers.
This research also provides some theoretical contributions.
First, as part of this research, we built a data dictionary that
other researchers and practitioners can use in the data analytics
text mining arena. We started with an established dictionary
from Deng, Li, and Galliers (2016) and Sodhi and Son (2009).
We then used an empirical approach to identify words from job
postings that were missing from the original list. This
comprehensive dictionary (see Appendix A) was built and
utilized for this research. Second, this research can help build
the literature in this area. To our knowledge, there are only a
few previously published articles that examine the data
analytics field using job postings. Our research has a larger
corpus and is more current.
5.3 Limitations
There are limitations to this research which should be noted.
First, the number of job postings listed is not comprehensive.
The job postings only include a sample of all the job postings
for that year. This is a limitation of the Common Crawl source.
As previously mentioned, Indeed.com does not store historical
data, so we used Common Crawl to retrieve the data from years
past. There could have been days when Common Crawl did not
archive the Indeed.com website, and during that time, a job
posting might have appeared and then disappeared. We can
make assertions about only a sample of job postings, not the
entire corpus of job postings.
Our second limitation is our statistical method to measure
trends over time. Since there is only one data point per year, we
could not calculate a variance or standard error. This prevented
us from using a longitudinal analysis using the five years as a
trend. Therefore, our trend analysis only covered two points in
time – 2014 and 2018. We did not capture a trend if a skill had
the same percentage in 2014 and 2018 (i.e., resulting in no
statistical significance in the proportions test) but either spiked
or plummeted in the years between. However, we examined
each item to verify whether this scenario existed, and we could
not find any item that had a significant rise or fall of the trend
between 2014 and 2018 with 2014 and 2018 having
approximately the same value. There is another possible
scenario in which the proportion test may indicate a positive
increase, but the overall trend is declining in the last few years.
For example, one item could start at 12% in 2014, spike to 20%
in 2015, then decline steadily over the next 3 years to 15% by
2018. Obviously, this is a declining trend and would be a fading
trend in the analytics space, but our proportion test would show
a significant increase between 2014 and 2018. We checked the
entire dataset and could not find an example of this trend.
Therefore, we are confident that the proportion test adequately
answers our research questions.
Our third limitation is that we only examined entry-level
positions and only general domain skills and software skills. A
comprehensive study would have examined all levels and
included soft skills. We decided not to include these analyses in
this research due to sample size limitations. These analyses
would be included in future research.
Our last limitation is that we examined job postings written
by employers themselves. Each company may have a different
idea of what a skillset is for their employees. Therefore, there
could be variance in vague general domain skills like general
statistics. However, this limitation is also a contribution of our
research since we summarized over 9,000 job postings over 5
years. Our summarized results show that general domain skills
like general statistics are still widely used in job postings.
6. CO
NCLUSION
In summary, this research examined job postings from 2014 to
2018 for entry-level data analytics jobs from Indeed.com. Using
a custom data dictionary built from previous literature and
empirical data, we employed a text mining approach to identify
word frequencies in the job postings. Using a difference of
proportions, we identified general domain skills and software
skills that trended over time. General analytics, general
statistics, modeling, and data management all appear in at least
20% of the job postings in our sample, with general analytics
Journal of Information Systems Education, Vol. 31(4) Fall 2020
320

a
ppearing in almost 70% of job postings. We find that Python,
Tableau, and R software skills are in high demand, and
Microsoft Access, Cognos, and SAP are in slow decline. We
also analyzed job postings by state and education level. We find
that at least a bachelor’s degree is required in 70% of the job
postings in our sample. Using the results of the study,
universities can make better-informed curriculum decisions,
and instructors can decide what skills to teach based on industry
needs. Our custom text mining dictionary can be added to the
growing literature and assist other researchers in this space. We
also identified limitations to this research and ideas for future
work.
7. ACKNOWLEDGEMENTS
Our thanks to the Journal of Information Systems Education
editor and reviewers for their advice and suggestions. We
would like to thank Dr. Robert Scherer whose comments and
suggestions helped improve and clarify this manuscript. This
research was supported by the Faculty Research Start-up Fund
and the Summer Research Stipend Program for 2018 of Trinity
University.
8. REFERENCES
Aasheim, C., Li, L., & Williams, S. (2009). Knowledge and
Skill Requirements for Information Technology Graduates:
A Comparison of Industry and Academia. Journal of
Information Systems Education, 20(3), 349-356.
Aasheim, C., Shropshire, J., Li, L., & Kadlec, C. (2012).
Knowledge and Skill Requirements for Entry-Level IT
Workers: A Longitudinal Study. Journal of Information
Systems Education, 23(2), 193.
Aasheim, C., Williams, S., & Butler, E. S. (2009). Knowledge
and Skill Requirements for IT Graduates: A Survey of IT
Workers and Managers. Journal of Computer Information
Systems, 42, 690-699.
Aasheim, C., Williams, S., Rutner, P., & Gardiner, A. (2015).
Data Analytics Vs. Data Science: A Study of Similarities and
Differences in Undergraduate Programs Based on Course
Descriptions. Journal of Information Systems Education,
26(2), 103-115.
Aken, A., Litecky, C., Ahmad, A., & Nelson, J. (2010). Mining
for Computing Jobs. IEEE Software, 27(1), 78-85.
Batikas, M., Claussen, J., & Peukert, C. (2018). Follow the
Money: Online Piracy and Self-Regulation in the
Advertising Industry (SSRN Scholarly Paper ID 3140358).
Social Science Research Network.
https://papers.ssrn.com/abstract=3140358
.
Bila, A. (2018). 7 Top Tech Skills In High Demand For 2019,
LinkedIn. Retrieved September 9, 2019, from
https://www.linkedin.com/pulse/7-top-tech-skills-high-
demand-2019-anna-bila.
Bloom, B. S. (1956). Taxonomy of Educational Objectives:
Handbook 1: Cognitive Domain. New York: David McKay.
Bowers, J. W. & Courtright, J. A. (1984). Communication
Research Methods. Glenview, Illinois: Scott, Foresman.
Bowne-Anderson, H. (2018). What Data Scientists Really Do,
According to 35 Data Scientists. Harvard Business Review.
Retrieved September 1, 2019, from
https://hbr.org/2018/08/what-data-scientists-really-do-
according-to-35-data-scientists.
Burkholder L. (1992). Philosophy and the Computer. Boulder,
Colorado: Westview Press.
Chen, H., Chiang, R. H., & Storey, V. C. (2012). Business
Intelligence and Analytics: From Big Data to Big Impact.
MIS Quarterly, 36(4), 1165-1188.
Church, K. W. (1988). A Stochastic Parts Program and Noun
Phrase Parser for Unrestricted Text. Second Conference on
Applied Natural Language Processing, 136-143.
Cafarella, M., Halevy, A., Lee, H., Madhavan, J., Yu, C., Wang,
D. Z., & Wu, E. (2018). Ten Years of Webtables.
Proceedings of the VLDB Endowment, 11(12), 2140-2149.
Columbus, L. (2017). IBM Predicts Demand for Data Scientists
Will Soar 28% By 2020. Forbes. Retrieved September 19,
2019, from
https://www.forbes.com/sites/louiscolumbus/2017/05/13/ib
m-predicts-demand-for-data-scientists-will-soar-28-by-
2020/#670c4c217e3b.
Davenport, T. H., Barth, P., & Bean, R. (2012). How Big Data
Is Different. MIT Sloan Management Review, 54(1).
Davenport, T. H. & Patil, D. (2012). Data Scientist. Harvard
Business Review, 90(5), 70-76.
Deng, X. N., Li, Y., & Galliers, R. D. (2016). Business
Analytics Education: A Latent Semantic Analysis of Skills,
Knowledge and Abilities Required for Business Versus Non-
Business Graduates. Proceedings from Thirty Seventh
International Conference on Information Systems, Dublin.
Gallivan, M. J., Truex III, D. P., & Kvasny, L. (2004). Changing
Patterns in IT Skill Sets 1988-2003: A Content Analysis of
Classified Advertising. ACM SIGMIS Database: the
DATABASE for Advances in Information Systems, 35(3), 64-
87.
Gardiner, A., Aasheim, C., Rutner, P., & Williams, S. (2018).
Skill Requirements in Big Data: A Content Analysis of Job
Advertisements. Journal of Computer Information Systems,
58(4), 374-384.
Gupta, B., Goul, M., & Dinter, B. (2015). Business Intelligence
and Big Data in Higher Education: Status of a Multi-Year
Model Curriculum Development Effort for Business School
Undergraduates, MS Graduates, and MBAs.
Communications of the Association for Information Systems,
36(23), 449-476.
Holsapple, C., Lee-Post, A., & Pakath, R. (2014). A Unified
Foundation for Business Analytics. Decision Support
Systems, 64, 130-141.
Jurafsky, D. & Martin, J. H. (2008). Speech and Language
Processing: An Introduction to Natural Language
Processing, Computational Linguistics, and Speech
Recognition. Prentice Hall Series in Artificial Intelligence,
1-1024.
Key Industries. (n.d.). Virginia Economic Development
Partnership, Retrieved September 1, 2019, from
www.vedp.org/key-industries
.
Khambhammettu, P. (2005). Mann-Kendall Analysis,
HydroGeoLogic Inc. OU-1 Annual Groundwater Monitoring
Report–Former Fort Ord, California.
Journal of Information Systems Education, Vol. 31(4) Fall 2020
321

L
andis, J. R. and Koch, G. G. (1977). The Measurement of
Observer Agreement for Categorical Data. Biometrics,
33(1), 159-174.
Lauby S. (2013). The Difference between Knowledge, Skills
and Abilities. HR Bartender Retrieved from
https://www.hrbartender.com/2013/recruiting/the-
difference-between-knowledge-skills-and-abilities/.
Lewis-Beck, M. S. (1995). Data Analysis: An Introduction,
Sage Publications, Inc.
Liberatore, M. & Luo, W. (2013). ASP, The Art and Science of
Practice: A Comparison of Technical and Soft Skill
Requirements for Analytics and OR Professionals.
Interfaces, 43(2), 194-197.
Loukides, M. (2011). What is Data Science? O’Reilly Media,
Inc. Retrieved August 22, 2019, from
https://www.oreilly.com/radar/what-is-data-science/
.
Luo, W. (2016). Responsibility and Skills Requirements for
Entry Level Analytics Professionals. Journal of
Organizational and End User Computing, 28(4), 1-14.
Lyon, L., Mattern, E., Acker, A., & Langmead, A. (2015).
Applying Translational Principles to Data Science
Curriculum Development. iPRES 2015.
Microsoft Community Support Pages. (2017). “Decline in use
of Access Database?” Retrieved April 29, 2019, from
https://answers.microsoft.com/en-
us/msoffice/forum/all/decline-in-use-of-access-
database/3407c710-7b98-4abe-835c-cb7c8b533641.
Miller, S. & Hughes, D. (2017). The Quant Crunch: How the
Demand for Data Science Skills is Disrupting the Job
Market. Retrieved from
https://www.bhef.com/publications/quant-crunch-how-
demand-data-science-skills-disrupting-job-market.
Mills, R. J., Chudoba, K. M., & Olsen, D. H. (2016). IS
Programs Responding to Industry Demands for Data
Scientists: A Comparison Between 2011-2016. Journal of
Information Systems Education, 27(2), 131.
Moore, E. (2018). 9 Perfect Jobs for Career Changers.
Glassdoor. Retrieved July 19, 2019, from
https://www.glassdoor.com/blog/jobs-for-career-changers/
.
Mosbrucker, K. (2018). Microsoft Plans for More Area Data
Centers Worth $62M, Bizjournals.com, Retrieved July 19,
2019, from
www.bizjournals.com/sanantonio/news/2018/09/07/microso
ft-plans-for-more-area-data-centers-worth.html.
Mudambi, S. M., & Schuff, D. (2010). What Makes A Helpful
Review? A Study of Customer Reviews on Amazon.com.
MIS Quarterly, 34(1), 185-200.
NAICS Association. (2019). Retrieved August 8, 2019, from
https://www.naics.com/business-lists/counts-by-state/
.
Pal, K. (2016). Why the World is Moving toward NoSQL
Databases?” Techopodia. Retrieved June 7, 2016, from
https://www.techopedia.com/2/32000/trends/big-data/why-
the-world-is-moving-toward-nosql-databases.
Power, D. J. (2007). A Brief History of Decision Support
Systems. Retrieved from DSSResources.com
.
PWC. (2017). Investing in America’s Data Science and
Analytics Talent. Retrieved from
http://pwc.com/us/dsa-
skills.
Schlee, R. & Harich, K. (2010). Knowledge and Skill
Requirements for Marketing Jobs in the 21
st
Century.
Journal of Marketing Education, 32(3), 341-352.
Scorsone, G. (2018). 5 Hot and High-Paying Tech Skills for
2018. Retrieved July 19, 2019, from
https://www.idginsiderpro.com/article/3269251/5-hot-and-
high-paying-tech-skills-for-2018.html.
Silva, Y. N., Dietrich, S. W., Reed, J. M., & Tsosie, L. M.
(2014). Integrating Big Data into the Computing Curricula.
Proceedings of the 45th ACM Technical Symposium on
Computer Science Education.
Sodhi, M. & Son, B. G. (2009). Content Analysis of OR Job
Advertisements to Infer Required Skills. Journal of the
Operational Research Society, 61(9), 1315-1327.
Toutanova, K. & Manning, C. D. (2000). Enriching the
Knowledge Sources Used in a Maximum Entropy Part-Of-
Speech Tagger. Proceedings of the 2000 Joint SIGDAT
Conference on Empirical Methods in Natural Language
Processing and Very Large Corpora: Held in Conjunction
with the 38th Annual Meeting of the Association for
Computational Linguistics, 13, 63-70.
Turel, O. & Kapoor, B. (2016). A Business Analytics Maturity
Perspective on The Gap Between Business Schools and
Presumed Industry Needs. Communications of the
Association for Information Systems, 39(6), 96-109.
Voutilainen, A. (2003). Part-Of-Speech Tagging. The Oxford
Handbook of Computational Linguistics. 219-232.
Wang, T., Kannan, K. N., & Ulmer, J. R. (2013). The
Association between the Disclosure and The Realization of
Information Security Risk Factors. Information Systems
Research, 24(2), 201-218.
AUTHOR BIOGRAPHIES
Tianxi Dong is an assistant professor of business analytics and
technology at Trinity University.
She earned her B.S. and M.S. in
management information systems
(MIS) from Shanghai University
of Finance and Economics. She
received her Ph.D. in MIS from the
Rawls College of Business at
Texas Tech University. She has
published in Communications of
the Association for Information
Systems, Journal of the American
Society for Information Science and Technology, and Journal
of Service Science and Management. Her current research
interests include business value of IT, information system
security, and data analytics.
Jason Triche is the Pat and Judy McDonald Faculty Fellow and
an associate professor of MIS at the
University of Montana. He received his
Ph.D. from the Rawls College of
Business at Texas Tech University.
Triche has ten years of industry
experience in technology and
management consulting as well as
project management and holds a PMP.
His current research interests include
impression management, technology
failures, and data analytics.
Journal of Information Systems Education, Vol. 31(4) Fall 2020
322

APPENDIX A. Final Dictionary (Categories, Subcategories, and Keywords)
1.Technical Skills
1.1 General Analytical
Analysis
Analysis and design
Analysis and reporting
Analysis skills
Analysis support
Analysis techniques
Analysis to support
Analysis tools
Analytic support
Analytical abilities
Analytical methods
Analytical projects
Analytical results
Analytical support
Analytical techniques
Analytical tools
Analyzing information
Quantitative analysis
Quantitative and qualitative
1.2 General Statistics
anova
Advanced statistics
Data modeling
Linear and logistic
Linear models
Predictive models
r-square
Regression
Statistical analyses
Statistical analysis
Statistical data analysis
Statistical methods
Statistical modeling
Statistical models
Statistical process
Statistical reports
Statistical techniques
Statistical tests
Statistics
Summarizing data
1.3 Modeling
Algorithm
Algorithm design
Algorithm development
Algorithms
Algorithms and applications
Algorithms and formulations
Algorithms in solving real
Algorithms to match online
AMPL
Combinatorial optimization
Constraint based
Constraint programming
Cplex
Decision analysis
Decision making
Decision problems
Decision science
Decision sciences
Decision support
Decision support analysis
Decision support applications
Decision support functions
Decision support models
Decision support research
Decision support research analyst
Decision support software
Decision support systems
Decision support tools
Decision tools
Decision trees
Forecasting
Integer
Linear programming
Mathematical modeling
Mathematical models
Mathematical programming
MATLAB
Nonlinear
Non-linear
Optimization
Quadratic
Stochastic optimization
1.4 Model development
Model development
Model formulation
Modeling
Network modeling
Simulate
Simulation
Simulations
1.5 Data Management
Data analysis
Data set
Data collection
Data gathering
Data integrity
Data mining
Database management
Datamart
Dataset
ERD
etl
Large data
Relational databases
Software applications
Journal of Information Systems Education, Vol. 31(4) Fall 2020
323

2. Software Package Skills
2.1 Personal Productivity
Computer skills
Macros
Microsoft Office
Microsoft suite
Microsoft Word
MS Office
MS Word
o365
Power Point
PowerPoint
Spreadsheet
Spreadsheets
Word processing
2.2 Business Intelligence
Cognos
fixml
d3
pentaho
powerbi
tableau
2.3 Database Systems
Access and
And access
cassandra
DB2
dbms
Hbase
Microsoft Access
mongodb
MS Access
Mysql
Nosql
Oracle
SQL Server
*SQL*
Teradata
tsql
*XML*
xsd
xsl
2.4 Stats Packages
r
SAS
SPSS
STATA
2.5 Programming Language
C
C++
html
Linux
Pearl
Perl
pig
Python
ruby
VBA
Visual Basic
2.6 Enterprise System
Azure
Google Analytics
Hadoop
Hive
Salesforce
SAP
Watson
3. Academic Degree
3.1 Bachelor’s
Accredited college
BA
Bachelor of business administration
Bachelor of science
Bachelor’s
Bachelor’s degree
BS
College or university
3.2 Master’s
Advanced degree
Doctorate
Graduate degree
Master’s
Master’s degree
MS degree
3.3 Ph.D.
Master of business administration
MBA
MBA degree
Ph
PhD
PhD degree
Journal of Information Systems Education, Vol. 31(4) Fall 2020
324

APPENDIX B. Evolution of Software Skills for Data Analysts
Categories and Sub-Categories
2014
2015
2016
2017
2018
Personal Productivity
30.70%
29.70%
32.60%
32.10%
28.60%
Microsoft Office
18.40%
16.30%
20.60%
18.50%
17.20%
MS Power Point
12.10%
13.70%
13.70%
14.20%
13.90%
MS Excel
4.20%
3.90%
3.70%
5.80%
4.20%
MS Word
3.50%
4.70%
4.30%
3.80%
3.30%
Macros
1.70%
2.40%
1.50%
1.90%
1.50%
o365
0.00%
0.00%
0.20%
0.10%
0.00%
Database System
48.00%
48.80%
52.40%
58.10%
58.90%***
SQL Server
10.40%
12.10%
13.40%
15.20%
17.80%***
Oracle
15.00%
14.00%
13.40%
14.40%
15.50%
Microsoft Access
13.60%
11.60%
11.30%
11.60%
10.40%**
Teradata
2.30%
2.50%
2.50%
2.80%
3.10%
MySQL
1.50%
1.80%
3.00%
2.50%
2.10%
XML
2.70%
2.80%
3.00%
3.00%
2.00%
NoSQL
0.70%
1.00%
1.60%
1.50%
1.60%**
DB2
2.00%
2.00%
1.90%
1.60%
1.60%
DBMS
0.30%
0.60%
0.60%
0.90%
0.90%*
Hbase
0.30%
0.20%
0.30%
0.40%
0.60%
MongoDB
0.20%
0.40%
0.80%
0.40%
0.30%
tsql
0.50%
0.40%
0.60%
0.80%
0.20%
Cassandra
0.30%
0.20%
0.20%
0.30%
0.20%
xsl
0.00%
0.30%
0.00%
0.10%
0.00%
xsd
0.00%
0.20%
0.20%
0.00%
0.00%
Business Intelligence
11.30%
12.60%
17.60%
21.80%
23.20%***
Tableau
5.30%
8.30%
13.20%
18.20%
18.90%***
Cognos
7.50%
5.30%
5.30%
5.80%
6.00%*
PowerBI
0.10%
0.10%
1.00%
1.60%
1.90%***
Pentaho
0.40%
0.80%
0.60%
0.60%
0.30%
Journal of Information Systems Education, Vol. 31(4) Fall 2020
325

JavaScript D3
0.20%
0.00%
0.50%
0.40%
0.20%
fixml
0.00%
0.20%
0.20%
0.00%
0.00%
Statistical Package
10.10%
9.50%
12.40%
15.40%
16.10%***
SAS
6.60%
6.60%
8.00%
8.80%
9.70%***
SPSS
1.60%
1.90%
2.40%
3.70%
2.50%*
R
4.50%
4.40%
7.00%
9.60%
11.80%***
STATA
0.60%
0.40%
0.40%
1.10%
0.50%
Programming Language
16.00%
16.40%
20.20%
21.90%
22.50%***
Python
2.30%
3.30%
6.60%
9.10%
10.70%***
C
9.60%
7.90%
8.60%
9.90%
9.60%
HTML
2.80%
3.00%
3.90%
2.50%
2.70%
VBA
1.90%
2.60%
2.90%
2.60%
2.50%
Linux
1.90%
1.90%
2.50%
2.00%
1.70%
Visual Basic
1.40%
1.30%
1.40%
1.60%
1.20%
Pig
0.30%
0.50%
0.70%
0.60%
1.00%**
Perl
1.00%
0.90%
0.80%
1.60%
0.90%
Ruby
0.50%
0.30%
0.90%
1.20%
0.30%
C++
0.00%
0.00%
0.00%
0.00%
0.00%
Pearl
0.00%
0.20%
0.20%
0.10%
0.00%
Enterprise System
16.00%
15.80%
16.20%
18.50%
20.30%***
SAP
10.40%
9.00%
8.00%
8.40%
8.30%*
Hadoop
2.00%
2.40%
4.00%
4.50%
5.10%***
Salesforce
3.40%
4.50%
2.80%
4.50%
4.90%*
Azure
0.20%
0.00%
0.80%
1.30%
3.60%***
Hive
0.70%
1.10%
1.80%
1.80%
2.10%***
Google Analytics
0.50%
0.50%
1.50%
1.00%
1.20%*
Watson
0.40%
0.20%
0.10%
0.30%
0.20%
*p < 0.05, **p < 0.01, ***p < 0.001
Categories are underlined; Subcategories are indented.
Bold (italicized) text indicates a positive (negative) trend between 2014 and 2018.
Journal of Information Systems Education, Vol. 31(4) Fall 2020
326

Information Systems & Computing
Academic Professionals
STATEMENT OF PEER REVIEW INTEGRITY
All papers published in the Journal of Information Systems Education have undergone rigorous peer review. This includes an
initial editor screening and double-blind refereeing by three or more expert referees.
Copyright ©2020 by the Information Systems & Computing Academic Professionals, Inc. (ISCAP). Permission to make digital
or hard copies of all or part of this journal for personal or classroom use is granted without fee provided that copies are not made
or distributed for profit or commercial use. All copies must bear this notice and full citation. Permission from the Editor is
required to post to servers, redistribute to lists, or utilize in a for-profit or commercial use. Permission requests should be sent to
the Editor-in-Chief, Journal of Information Systems Education, editor@jise.org.
ISSN 2574-3872
