
CLOSING
THE
DIGITAL
SKILL
DIVIDE
FEBRUARY 2023
THE PAYOFF FOR
WORKERS, BUSINESS,
AND THE ECONOMY
By Amanda Bergson-Shilcock
and Roderick Taylor
with Nye Hodge

ACKNOWLEDGEMENTS
This report was written by Amanda Bergson-Shilcock and Roderick Taylor of National Skills Coalition
with data analysis by Nye Hodge, Federal Reserve Bank of Atlanta. The report team included Jeannine
LaPrad and Rachel Unruh of National Skills Coalition and Sarah Miller, Federal Reserve Bank of Atlanta.
The opinions expressed in this report reflect those of the authors and do not necessarily reflect those of
the Federal Reserve System or the Federal Reserve Bank of Atlanta.
About National Skills Coalition: Jobs that require skills training are the backbone of our economy.
National Skills Coalition fights for a national commitment to inclusive, high-quality skills training so
that more people have access to a better life, and more local businesses see sustained growth. Since
2000, through expert analysis and technical assistance, broad-based organizing, targeted advocacy, and
cutting-edge communications, NSC has changed hundreds of state and federal skills policies that have
changed thousands of lives and grown local businesses and economies.
About the Center for Workforce and Economic Opportunity at the Federal Reserve Bank of Atlanta:
The Center for Workforce and Economic Opportunity focuses on employment policies and labor mar-
ket issues that affect low- and moderate-income individuals. It acts as a bridge between research and
practice, connecting researchers, businesses, and policymakers with innovative approaches to creating
economic opportunity through education and employment. The center also contributes to economic
research and monetary policy discussions by tracking labor market trends affecting low- and moder-
ate-income workers.
CLOSING THE DIGITAL SKILL DIVIDE: THE PAYOFF FOR WORKERS, BUSINESS, AND THE ECONOMY 1

TABLE OF CONTENTS
EXECUTIVE SUMMARY .............................................................. 3
CLOSING THE DIGITAL SKILL DIVIDE ..................................... 7
Missing from the digital divide discussion: Skills ...................... 8
Almost all jobs now require digital skills ..................................... 9
Not just a silicon valley problem: The digital skill
divide spans every industry and firm size .................................. 13
Inequities within the digital skill divide........................................ 14
The payoff of closing the digital skill divide ............................... 15
RECOMMENDATIONS .................................................................. 18
ENDNOTES .................................................................................... 20
APPENDIX ..................................................................................... 23
State Profile: North Carolina ....................................................... 25
State Profile: Illinois ....................................................................... 38
METHODOLOGY ............................................................................ 52
CLOSING THE DIGITAL SKILL DIVIDE: THE PAYOFF FOR WORKERS, BUSINESS, AND THE ECONOMY 1

NOW — AS LEADERS DESIGN
LABOR MARKET POLICIES
TO DRIVE A THRIVING AND
INCLUSIVE ECONOMY — IT IS
IMPERATIVE TO UNDERSTAND
THIS ACCELERATION OF
DIGITAL TRANSFORMATION.
2 CLOSING THE DIGITAL SKILL DIVIDE: THE PAYOFF FOR WORKERS, BUSINESS, AND THE ECONOMY CLOSING THE DIGITAL SKILL DIVIDE: THE PAYOFF FOR WORKERS, BUSINESS, AND THE ECONOMY 3

EXECUTIVE
SUMMARY
E
ven before the coronavirus pandem-
ic began, policymakers, business-
es, and workforce advocates were
already recognizing that workers
were not being replaced by robots, but rather,
being called upon to work hand-in-glove with
rapidly evolving technology.
When the pandemic struck, millions of U.S.
companies hustled to change how they did
business. Nearly every worker suddenly had
to contend with new digital demands — even
those in frontline, essential roles. The im
-
pact of the digital skill divide became more
acute, weighing disproportionately on work
-
ers of color and smaller businesses strug-
gling to survive a tumultuous economy.
Now — as leaders design labor market poli
-
cies to drive a thriving and inclusive econ-
omy — it is imperative to understand this
digital transformation. This report takes
a first-ever look at the demand for digital
skills in the U.S. economy, as measured by
a dataset of 43 million “Help Wanted” ads
posted during 2021.
1
The opinions expressed in this report reflect those of the
authors and do not necessarily reflect those of the Federal
Reserve System or the Federal Reserve Bank of Atlanta.
A note about terminology:
This report uses digital
skills and technology
skills interchangeably.
2 CLOSING THE DIGITAL SKILL DIVIDE: THE PAYOFF FOR WORKERS, BUSINESS, AND THE ECONOMY CLOSING THE DIGITAL SKILL DIVIDE: THE PAYOFF FOR WORKERS, BUSINESS, AND THE ECONOMY 3

The findings in this analysis are unequivocal:
■
There is overwhelming demand for digital skills
in the labor market, with 92 percent of all job ads
requiring definitely digital or likely digital
2
skills.
This demand is robust across all industries, and
small businesses are just as likely as their larger
peers to seek workers with technology skills.
■
Yet many workers have not had sufficient oppor-
tunity to build such skills; earlier research found
that nearly one-third of U.S. workers do not have
foundational digital skills, and workers of color fall
disproportionately into this category due to struc-
tural inequities.
3
■
Equipping workers with necessary skills requires
action by both private employers and public policy-
makers. Notably, public investments in workforce
development and education are especially vital
given the unevenness of private investments and the
prevalence of digital skill demands among smaller
businesses, which depend on publicly funded work-
force and education partners to upskill employees.
■
Closing the digital skill divide has major payoffs for
businesses. Prior research has shown that workers
value upskilling opportunities and prefer working
for employers who offer clear, well-defined path-
ways to advancement.
4
Because turnover has heavy
costs for businesses – with estimates ranging from
$25,000 for workers who leave within the first year
to over $78,000 for workers who leave after five
years,
5
averting or delaying turnover by ensuring
that workers have upskilling opportunities can be
economically significant.
■
Public investments in closing the digital skill divide
can also generate economic benefits for individ-
ual workers and the broader economy. People
who qualify for jobs that require even one digital
skill can earn an average of 23 percent more than
those working in jobs requiring no digital skills —
an increase of $8,000 per year for an individual
worker.
6
These increased earnings could result in
more state and federal tax revenue generated by
each worker. Depending on the household size and
composition, this could range from $1,363 to $2,879
per year.
7
SKILLS HAVE BEEN MISSING FROM
THE DIGITAL DIVIDE CONVERSATION
Vivid news stories of the “homework gap” have helped
drive public awareness and urgency around access to
broadband and high-quality devices. But, while the dig-
ital access divide has gotten high-profile coverage, the
digital skill divide has not.
Awareness of the digital skill divide began to grow with
passage of the $2.75 billion Digital Equity Act
8
as part
of the 2021 federal infrastructure law. This funding will
help people build digital skills as well as obtain access
to broadband and devices, and will help states to close
equity gaps among key populations, including people
of color, low-income individuals, veterans, and rural
residents.
ACROSS
INDUSTRIES,
92%
OF JOBS
REQUIRE DIGITAL
SKILLS
47%
definitely require
digital skills
8%
do not require
digital skills
45%
likely require
digital skills
EXECUTIVE SUMMARY
4 CLOSING THE DIGITAL SKILL DIVIDE: THE PAYOFF FOR WORKERS, BUSINESS, AND THE ECONOMY CLOSING THE DIGITAL SKILL DIVIDE: THE PAYOFF FOR WORKERS, BUSINESS, AND THE ECONOMY 5

RECOMMENDATIONS
Ensuring that public investments are intentionally
focused to remedy the digital skill divide and related
inequities is vital to U.S. economic success.
9
As the fed-
eral Digital Equity Act is implemented in states, policy-
makers will have a powerful opportunity to close gaps in
racial, gender, age and geographic equity. Similarly, as
officials work to update landmark policies such as the
Workforce Innovation and Opportunity Act (WIOA), it is
crucial to incorporate the latest findings on how to close
the digital skill divide.
Building on the findings laid out in this report, there
are three overarching principles to guide leaders’
decisionmaking:
1. A digital skill foundation for all.
All workers need the opportunity to develop broad-
based, flexible digital problem-solving skills for current
technologies and ongoing technological shifts.
■
Policymakers can support this goal by investing in
free or low-cost digital skills training for workers, and
ensuring that workforce development and education
providers are equipped to provide high-quality upskill-
ing programs.
■
Workforce and education advocates and providers
can support this goal by speaking up for digital equity
investments that support workers’ goals and aspira-
tions and respond to local businesses’ skill needs.
■
Corporate decisionmakers and influencers can use
their platforms to ensure that skills are central to digi-
tal divide discussions in the public and policymaking
spheres.
2. Ongoing upskilling for every worker in every
workplace.
Workers in every industry need the opportunity to
develop industry- and occupation-specific digital skills to
adapt and advance in their careers.
■
Policymakers can support this goal by investing in
industry sector partnerships
10
that can collaborate
with community colleges and other training providers
to ensure that the talent development process is con-
nected to industry-specific skill needs and jobs.
■
Workforce and education advocates and providers
can encourage policymakers to embed digital prob-
lem-solving skills as allowable or required activities
under existing workforce development, adult educa-
tion, and higher education policies, as well as digital
equity policies.
11
■
Corporate decisionmakers and influencers can
implement policies and practices that support digital
upskilling for workers at every level of their organiza-
tions. Smaller businesses can participate in regional
industry partnerships that support these efforts
across small businesses at scale.
3. Rapid reskilling for rapid re-employment.
We need to be ready for sudden disruptions to the labor
market or specific industries. Policies should support
rapid reskilling so workers can move from one industry
to another.
■
Policymakers can support this goal by supporting
access to skills for workers who have lost their jobs,
including those transitioning to a new industry. This
includes ensuring that student financial aid policies
match the reality of how digital skills are acquired.
■
Workforce and education advocates and
providers can support this goal by sharing their
expertise with policymakers on topics such as best
practices in closing racial equity gaps in digital
skill-building opportunities.
■
Influencers and corporate decisionmakers can
educate state and federal policymakers about the
skills mismatches they are experiencing and the
kinds of technology skills their companies need to
be successful.
CONCLUSION
Despite the high demand for digital skills and the desire
for skill building opportunities among workers, many
have not had the opportunity to fully develop such
skills.
12
These burdens fall unequally on workers and
entrepreneurs of color. Investing in digital skill-building
can help individual workers increase their incomes,
allow businesses to thrive, and create positive eco-
nomic spillover effects for local, state, and national
economies.
This report puts actionable data into the hands of
elected officials, education and training providers, and
corporate decisionmakers, allowing them to fully tackle
the skills aspect of the digital divide.
EXECUTIVE SUMMARY
4 CLOSING THE DIGITAL SKILL DIVIDE: THE PAYOFF FOR WORKERS, BUSINESS, AND THE ECONOMY CLOSING THE DIGITAL SKILL DIVIDE: THE PAYOFF FOR WORKERS, BUSINESS, AND THE ECONOMY 5

WHAT IS A DIGITAL SKILL?
Some digital skills are foundational
skills such as email, simple spread-
sheets, data entry, or timecard soft-
ware. Others are industry-specific
skills, such as bookkeepers using
QuickBooks, manufacturing workers
using AutoCAD, or home health aides
using electronic medical records.
WHAT IS THE
DIGITAL SKILL DIVIDE?
The digital skill divide is the space
between those who have the robust
access and support needed to engage
in skill-building opportunities and those
who do not. As technology evolves, the
digital skill divide prevents equal par-
ticipation and opportunity in all parts
of life – including people’s ability to get
good jobs and advance in a career.
13
6 CLOSING THE DIGITAL SKILL DIVIDE: THE PAYOFF FOR WORKERS, BUSINESS, AND THE ECONOMY CLOSING THE DIGITAL SKILL DIVIDE: THE PAYOFF FOR WORKERS, BUSINESS, AND THE ECONOMY 7

E
ven before the coronavirus pandemic struck
in 2020, policymakers, businesses, and work-
force advocates were already recognizing that
workers were not being replaced by robots, but
rather, being called upon to work hand-in-glove with
rapidly evolving technology.
This new awareness brought home the importance of
developing digital resilience,
14
which equips workers and
businesses to continuously adapt to changing technolo-
gies. At the same time, it spotlighted the stark economic
costs caused by uneven investment in people’s skills and
new technologies — namely, decreased financial security
and career opportunities for workers themselves, and
reduced productivity for firms.
15
A growing understanding of this digital skill divide also
illuminated how the ripple effects of historical policies
and structural racism continue to contribute to mod-
ern-day inequities in digital skills and access,
16
and the
vital role of public policy and practice in remedying
inequities caused by prior policies.
17
When the pandemic struck, millions of businesses hus-
tled to change how they served their customers. Nearly
every worker suddenly had to contend with new digital
demands — even those in frontline, essential roles. The
impact of the digital skill divide became more acute,
weighing disproportionately on some workers — includ-
ing workers of color and low-wage workers — and smaller
businesses struggling to survive a tumultuous economy.
Now — as leaders design labor market policies to drive
a thriving and inclusive economy — it is imperative to
understand this acceleration of digital transformation.
The findings in this analysis are unequivocal: policymak-
ers, business leaders, workforce advocates, educators,
and training providers who gain perspective on this
transformation and its impact on the digital skill divide
(including population inequities within that divide), will
be well-positioned to reap the economic payoff of clos-
ing the divide.
Key findings include:
■
There is overwhelming demand for digital skills in the
labor market, with 92 percent of all job ads requiring
definitely digital or likely digital skills. This demand
is robust across all industries, and holds true even for
entry-level jobs that require zero to two years of expe-
rience or a high school diploma. And small businesses
are just as likely as their larger peers to seek workers
with technology skills.
■
Yet, many workers have not had sufficient oppor-
tunity to build such skills; earlier research found
that nearly one-third of U.S. workers do not have
foundational digital skills, and workers of color fall
disproportionately into this category due to structural
inequities.
18
■
Equipping workers with necessary skills requires action
by both private employers and public policymakers.
Notably, public investments in workforce develop-
ment and education are especially vital given the
unevenness of private investments and the prevalence
of digital skill demands among smaller businesses.
Small businesses employ 47 percent of private-sector
workers
19
and rely more heavily on publicly funded
CLOSING THE
DIGITAL SKILL DIVIDE
THE PAYOFF FOR WORKERS, BUSINESS,
AND THE ECONOMY
ACROSS
INDUSTRIES,
92%
OF JOBS
REQUIRE DIGITAL
SKILLS
47%
definitely require
digital skills
8%
do not require
digital skills
45%
likely require
digital skills
6 CLOSING THE DIGITAL SKILL DIVIDE: THE PAYOFF FOR WORKERS, BUSINESS, AND THE ECONOMY CLOSING THE DIGITAL SKILL DIVIDE: THE PAYOFF FOR WORKERS, BUSINESS, AND THE ECONOMY 7

workforce development and education partners
(rather than in-house programs) to upskill employees.
■
Closing the digital skill divide has major payoffs for
businesses. Prior research has shown that workers
value upskilling opportunities and prefer working for
employers who offer clear, well-defined pathways
to advancement.
20
Because turnover has heavy
costs for businesses — with estimates ranging from
$25,000 for workers who leave within the first year
to over $78,000 for workers who leave after five
years,
21
averting or delaying turnover by ensuring
that workers have upskilling opportunities can be
economically significant.
■
Public investments in closing the digital skill divide
can also generate economic benefits for individual
HOW THIS REPORT WAS PRODUCED
To produce this report, the research team analyzed
43 million online job postings published in 2021 and
collected by Lightcast (formerly known as Emsi
Burning Glass). The dataset assembled by Lightcast
included information on the particular skills associ-
ated with each job posting.
The typical job ad required applicants to have 8
different skills. Across all ads, there were 15,000
distinct skills extracted and standardized by
Lightcast from the universe of 2021 job ads. The
authors of this report manually coded the top
50 percent of these skills — that is, the 7,500
skills that were most often requested in job ads.
(Notably, however, this top 50 percent accounted
for 99.99 percent of job ads, while the remaining
uncoded skills only accounted for .01 percent of
jobs.) This coding formed the basis for the original
analysis and findings in this report.
The research team coded each skill according to
whether it was definitely digital, likely digital, or
not digital. Knowledge of Salesforce software or
the Python programming language were coded
as definitely digital. An example of a likely digital
skill would be survey design or bookkeeping —
tasks that today are frequently accomplished
with the use of a computer or other digital device,
but could still be carried out in an old-fashioned
analog fashion. An example of a not digital skill is
changing diapers.
Further information is available in the
Methodology section at the end of this report.
workers and the broader economy. People who
qualify for jobs that require even one digital skill
can earn an average of 23 percent more than
those working in jobs requiring no digital skills —
an increase of $8,000 per year for an individual
worker.
22
These increased earnings could result in
more state and federal tax revenue generated by
each worker. Depending on the household size and
composition, this could range from $1,363 to $2,879
per year.
23
MISSING FROM THE DIGITAL DIVIDE
DISCUSSION: SKILLS
The time is ripe for an analysis of this issue. In the past
few years, vivid news stories of the “homework gap”
coupled with images of people — often low-income fami-
lies of color — trying to access wifi from parking lots and
other makeshift setups have helped drive public aware-
ness and urgency around solving the digital divide.
Policymakers at all levels of government have responded
with initiatives to help individuals and businesses access
high-speed internet, obtain digital devices, and otherwise
equip themselves for full participation in today’s increas-
ingly digital society. Corporate leaders, philanthropists,
educators, and worker advocates have been equally
motivated to tackle these widespread challenges.
But, while the digital access divide has gotten high-pro-
file coverage, the digital skill divide has a much lower
profile. This has only recently begun to change with pas-
sage of the federal Digital Equity Act as part of the land-
mark Infrastructure Investment and Jobs Act in 2021.
For the first time, Congress invested $2.75 billion in state
and local efforts to help people build digital skills as well
as obtain access to broadband and devices. Importantly,
this legislation identifies a number of “covered popula-
tions” — including people of color, low-income individ-
uals, rural residents, and veterans, among others — for
whom states must specifically work to close equity gaps
in digital access and skills.
24
As implementation of the new law begins, stakeholders
have a unique opportunity to build on the momentum
of this trailblazing legislation, while also identifying the
additional resources needed to fully address workers’
and businesses’ digital skill needs. This report puts
actionable data into the hands of elected officials,
education and training providers, and corporate
decisionmakers, positioning them to tackle the skills
aspect of the digital divide.
8 CLOSING THE DIGITAL SKILL DIVIDE: THE PAYOFF FOR WORKERS, BUSINESS, AND THE ECONOMY CLOSING THE DIGITAL SKILL DIVIDE: THE PAYOFF FOR WORKERS, BUSINESS, AND THE ECONOMY 9

ALMOST ALL JOBS NOW REQUIRE
DIGITAL SKILLS
The overwhelming majority of jobs in the U.S. labor
market now require technology skills. Fully 92 percent
of the forty-three million online job ads analyzed for
this study are seeking workers who have at least one
definitely digital or likely digital skill. More specifically,
nearly half (47 percent) of all job ads list at least one
skill that is definitely digital — that is, requiring job
applicants to be able to use a software program like
AutoCAD or QuickBooks. Another 45 percent of all
job ads list at least one skill that likely requires digital
capability, such as customer account review, making
travel arrangements, or clerical support.
This high demand for technologically skilled workers is
reflected across each of the fifty states, the District of
Columbia, and Puerto Rico. Hawaii and Alaska are at
the high end of the spectrum, with 93 percent of job
postings in both states requiring workers with definitely
digital or likely digital skills.
25
But even the state at the
bottom of the list, Montana, still shows a robust 88 per-
cent of all job ads seeking workers with definitely digital
or likely digital skills.
This demand for technology skills stretches across every
industry in the U.S., and nearly every occupation, includ-
ing entry-level and frontline workers. Gone are the days
when only software engineers or white collar workers
needed digital skills. Today, job ads seeking janitors, food
service workers, and agricultural workers also cite the
need for digital skills.
The importance of workers having a baseline of founda-
tional digital skills and experience with widely used soft-
ware products is illustrated by their appearance as some
of the most requested skills across all forty-three million
job postings. Indeed, across all 15,000 skills captured
in this dataset, Microsoft Excel was the ninth most
requested skill, mentioned in more than 4.9 million
postings, and the general skill of computer literacy was
thirteenth on the list.
Even entry-level jobs increasingly demand
digital skills.
Among job ads seeking workers with zero to two years of
experience — primarily new entrants to the workforce
26
— fully 95 percent of ads required a definitely digital
or likely digital skill. The numbers were only just barely
higher for workers with more experience. (See Figure 1.)
However, there was a difference within the subset of
ads requiring a definitely digital skill. Nearly half (49
percent) of jobs seeking entry-level workers with zero to
two years of experience included a definitely digital skill.
The number leapt to more than two-thirds (71 percent)
of ads for workers with three to five years of experience.
(Also shown in Figure 1.)
FIGURE 1: Digital skills are in high demand in job ads
for entry-level workers (2021)
2021 job ads
seeking:
Percentage of ads
requiring a likely
digital skill:
Percentage of ads
requiring a definitely
digital skill:
0-2 years of
experience
95% 49%
3-5 years 98% 71%
6-8 years 99% 81%
9+ years 98% 75%
Note: Because not all job ads include a “years of experience” require-
ment, this finding reflects the universe of the 20 million job postings for
which Lightcast was able to discern such a requirement
8 CLOSING THE DIGITAL SKILL DIVIDE: THE PAYOFF FOR WORKERS, BUSINESS, AND THE ECONOMY CLOSING THE DIGITAL SKILL DIVIDE: THE PAYOFF FOR WORKERS, BUSINESS, AND THE ECONOMY 9

Some occupations have especially fast growing
demand for digital skills.
While some occupations show slow but steady growth
in the percentage of job ads that require digital skills,
other occupations have shown a much quicker increase.
For example, in 2019 just 15 percent of ads for oilfield/
rig worker required a definitely digital skill. But just
two years later, in 2021, that number had risen to 38
percent. Other jobs with rapid increases included diesel
mechanic, community health worker, tool and die maker,
and loss prevention/asset protection specialist. These
examples show how rapidly the landscape is changing in
certain segments of the labor market.
Even jobs that require limited education still
demand digital skills.
Even positions that require workers to have relatively
less education are still overwhelmingly likely to require
digital skills. Fully 94 percent of job ads that require
applicants to have a high school diploma or equivalent
include at least one skill that is definitely digital or likely
digital. This number rises slightly for job ads requiring
higher-level educational credentials. (See Figure 2.)
FIGURE 2: Digital skills are required for workers
regardless of their educational level (2021)
27
Education level
required
Percentage of
ads requiring a
likely digital skill
Percentage of
ads requiring
a definitely
digital skill
High School 94% 46%
Associate’s 97% 47%
Bachelor’s 99% 74%
Master’s 97% 46%
PhD 97% 39%
Findings are similar among the subset of jobs that
require at least one definitely digital skill. Forty-six
percent of jobs requiring a high school diploma request
such skills, as do forty-seven percent of jobs requiring an
associate’s degree.
SURPRISING BUT TRUE: YOUNGER
WORKERS NEED DIGITAL SKILLS TOO.
While it is often assumed that younger workers
are so-called “digital natives” who automatically
know how to use technology, research shows this
is often not the case. An earlier study by NSC
found that fully 25 percent of workers with no
foundational digital skills and 29 percent of those
with very limited foundational skills were between
the ages of sixteen to thirty-four.
28
One reason behind this phenomenon is that
younger workers — like their older peers — often
have fragmented knowledge. That is, they are
comfortable with some digital tasks, such as
sending a text message or making a TikTok video,
but not comfortable with others, such as creat-
ing a spreadsheet. For this reason, it’s especially
important that workforce and education programs
provide opportunities for people to build from the
skills they have to the skills they need.
Avoiding assumptions about younger workers —
just like avoiding age-related stereotypes about
older workers — is crucial to ensuring that policies
and programs address the real rather than per-
ceived needs of workers and businesses.
Many jobs require industry-specific digital
skills, not just foundational skills.
Contrary to the assumption that simply acquiring
baseline, foundational skills might be sufficient for most
workers, there is robust demand for more sophisticated,
industry-specific skills. Many employers sought these
higher-level skills even for positions that required rela-
tively little education or experience.
For example, 92 percent of all jobs requiring 0-2 years
of experience required an industry-specific digital skill.
Within the subset of jobs that required a definitely
digital skill, nearly two-thirds, or 65 percent, required
applicants to have an industry-specific digital skill, either
alone or in combination with foundational digital skills.
Only 35 percent of these job postings requested founda-
tional skills alone.
29
10 CLOSING THE DIGITAL SKILL DIVIDE: THE PAYOFF FOR WORKERS, BUSINESS, AND THE ECONOMY CLOSING THE DIGITAL SKILL DIVIDE: THE PAYOFF FOR WORKERS, BUSINESS, AND THE ECONOMY 11

Again, looking within the subset of jobs that required
a definitely digital skill, there were somewhat similar
trends by level of education. In this case, jobs requiring
just a high school diploma were twice as likely to require
only foundational digital skills as jobs requiring educa-
tion or training beyond high school. But even then, a
robust 43 percent of jobs requiring a high school edu-
cation demanded industry-specific skills, either alone or
in combination with foundational skills. (See Figure 3.)
Examples include job postings for warehouse workers
that require robotics skills, and ads for security officers
that require digital video skills.
Full-time jobs are more likely to require digital
skills, but part-timers still need technological
expertise.
Fully 93 percent of ads seeking full-time workers sought
people with definitely digital or likely digital skills, com-
pared to 91 percent of ads seeking part-time workers.
However, within the sub-category of job ads seeking
workers with at least one definitely digital skill, there
was a divide: Nearly half (48 percent) of ads for full-time
workers required a definitely digital skill, compared to
one-third (31 percent) of postings for part-time workers.
FIGURE 3: Many employers seek workers with industry-specific digital skills (2021)
Level of education required
Percentage of definitely
digital jobs requiring
foundational digital
skills only
Percentage of definitely
digital jobs requiring
industry-specific
digital skills only
Percentage requiring
both foundational
and industry-specific
digital skills
High school diploma/equivalent 57% 16% 27%
Associate degree 33% 28% 40%
Bachelor degree 20% 39% 41%
Master degree 24% 49% 26%
Ph.D. 19% 62% 19%
NINETY-TWO PERCENT OF ALL JOB
ADS REQUIRE DEFINITELY DIGITAL OR
LIKELY DIGITAL SKILLS. THE DEMAND IS
ROBUST ACROSS ALL INDUSTRIES, EVEN
FOR ENTRY-LEVEL JOBS.
10 CLOSING THE DIGITAL SKILL DIVIDE: THE PAYOFF FOR WORKERS, BUSINESS, AND THE ECONOMY CLOSING THE DIGITAL SKILL DIVIDE: THE PAYOFF FOR WORKERS, BUSINESS, AND THE ECONOMY 11
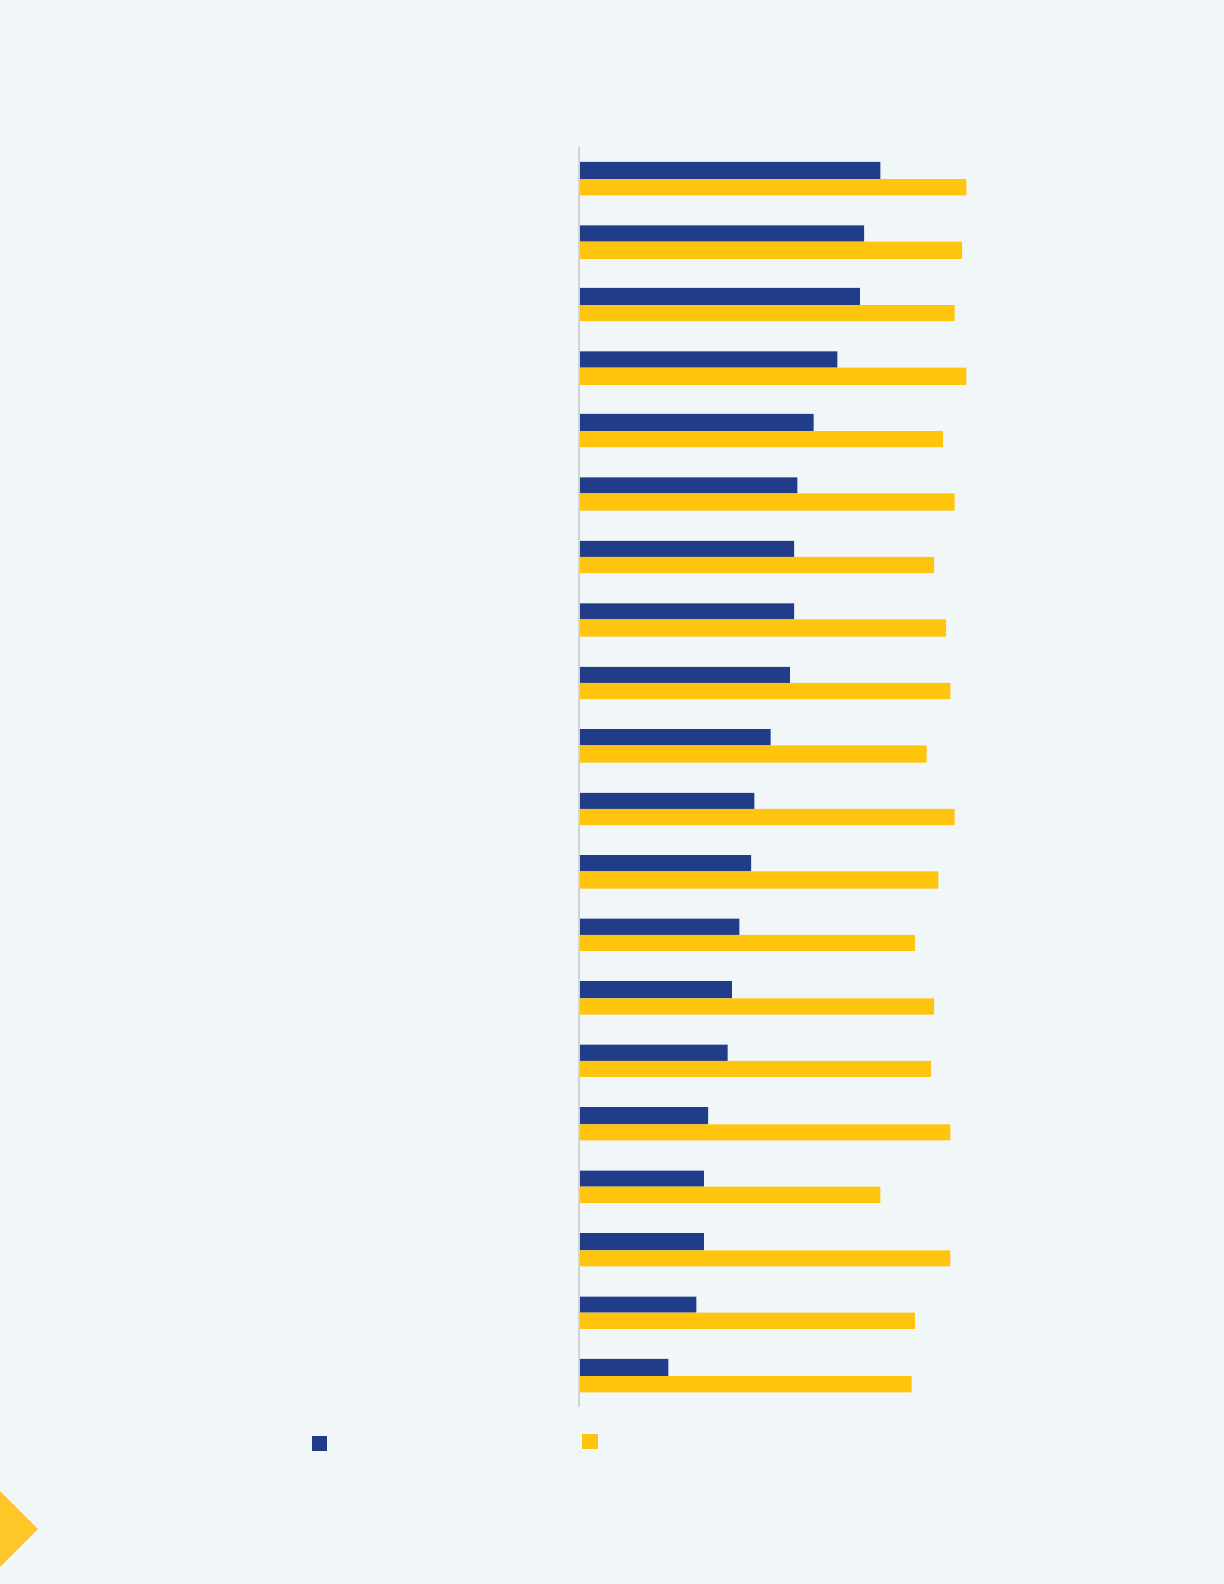
FIGURE 4: The demand for technology skills is robust across every industry (2021)
77%
73%
72%
66%
60%
56%
55%
55%
54%
49%
45%
44%
41%
39%
38%
33%
32%
32%
30%
23%
99%
98%
96%
99%
93%
96%
91%
94%
95%
89%
96%
92%
86%
91%
90%
95%
77%
95%
86%
85%
Information
Professional, Scientific, and Technical Services
Management of Companies and Enterprises
Finance and Insurance
Manufacturing
Public Administration
Utilities
Real Estate and Rental and Leasing
Wholesale Trade
Administrative and Support and
Waste Management and Remediation Services
Educational Services
Mining, Quarrying, and Oil and Gas Extraction
Agriculture, Forestry, Fishing and Hunting
Construction
Arts, Entertainment, and Recreation
Health Care and Social Assistance
Transportation and Warehousing
Retail Trade
Other Services (except Public Administration)
Accommodation and Food Services
Definitely digital skill required Likely or definitely digital skill required
12 CLOSING THE DIGITAL SKILL DIVIDE: THE PAYOFF FOR WORKERS, BUSINESS, AND THE ECONOMY CLOSING THE DIGITAL SKILL DIVIDE: THE PAYOFF FOR WORKERS, BUSINESS, AND THE ECONOMY 13

NOT JUST A SILICON VALLEY PROBLEM:
THE DIGITAL SKILL DIVIDE SPANS
EVERY INDUSTRY AND FIRM SIZE
Every industry shows strong demand for
digital skills.
A common misconception is that digital skills are pri-
marily required for information technology (IT) jobs or
are only needed for certain industries. This study found
that digital skills are widely required across the entire
range of industries in the U.S. economy.
As shown in Figure 4, the percentage of job ads requir-
ing definitely digital or likely digital skills ranges from
a low of 77 percent among the transportation and
warehousing industry sector to a high of 99 percent in
the information and finance and insurance industries.
That is, even in the industry sector at the lowest end of
the scale, fully three-quarters of job ads seek workers
with technology skills.
Even when the criteria are narrowed to include only
those job ads that require a definitely digital skill (also
shown in Figure 4), many industries still show more than
half of all job ads demanding such skills. Here there is a
wider spread between industries overall, with the high
end still the information sector at 77 percent, and the
low end now the accommodation and food services
sector at 23 percent.
30
Small businesses need technologically skilled
workers too.
Smaller businesses have almost identical demand for
workers with technology skills as larger businesses.
While the dataset used for this analysis does not directly
measure the size of a company, firm size can be roughly
inferred based on the volume of job ads posted by the
company in a year.
31
Even among the smallest businesses — those that posted
between one and fifty job ads per year — 90 percent of
ads required workers to have a definitely digital or likely
digital skill. (See Figure 5.) This is consistent with earlier
research from NSC
32
that found that small businesses
were nearly as likely as large ones to need workers with
digital skills, but that smaller companies relied much
more heavily on education and workforce partners to
help upskill workers, rather than developing full-scale
in-house upskilling programs.
FIGURE 5: Small businesses are almost as likely to post job ads requiring digital skills as larger
businesses (2021)
46%
49%
52%
53%
51%
44%
95%
94%
94%
94%
93%
90%
5001+ job ads
1001-5000 job ads
501-1000 job ads
101-500 job ads
51-100 job ads
1-50 job ads
posted in 2021
Likely or definitely digital skill requiredDefinitely digital skill required
12 CLOSING THE DIGITAL SKILL DIVIDE: THE PAYOFF FOR WORKERS, BUSINESS, AND THE ECONOMY CLOSING THE DIGITAL SKILL DIVIDE: THE PAYOFF FOR WORKERS, BUSINESS, AND THE ECONOMY 13

INEQUITIES WITHIN THE DIGITAL
SKILL DIVIDE
Some digitally-demanding industries employ
fewer workers of color.
The long history of occupational segregation in the
U.S. labor market means that workers of different
demographic backgrounds, particularly different
races and ethnicities, are often clustered in partic-
ular industries. Among the industries in this study
with the highest demand for workers with digital
skills (shown in Figure 4), several have a dispropor-
tionate concentration of white workers. This includes
the information industry (65 percent white) and the
finance and insurance industry (67 percent white).
33
While there are many factors behind the complex
issue of occupational segregation — such as lack of
access to quality education and training, language
barriers, structural inequities, etc. — examples such
as these are notable.
34
The relatively lower concen-
tration of workers of color in these industries sug-
gests that they are missing out on opportunities to
earn higher wages, which can worsen existing racial
inequities in income and wealth.
In occupations with many workers of color,
a changing demand for digital skills.
Although workers of color are more concentrated in
industries with slightly lower demand for digital skills,
the landscape is changing rapidly within some specific
occupations. For example, the percentage of job postings
for community health workers that required digital skills
increased by 28 percent from 2019 to 2021. Community
health workers are disproportionately likely to be Black or
Latino compared to the workforce as a whole.
35
Industries that employ people with limited education
nevertheless need workers with digital skills.
Close to half (43 percent) of workers in the manufactur-
ing industry have a high school education or less,
36
a fac-
tor that is strongly correlated with limited digital skills.
37
Yet a high percentage of job postings in manufacturing
call for workers to have definitely digital (60 percent)
or likely digital (93 percent) skills. There is a similar
phenomenon in the administrative and support and
waste management and remediation industries, where
51 percent of workers have a high school education or
less, while job postings call for workers with definitely
(49 percent) or likely (89 percent) digital skills.
A HIGH PERCENTAGE OF JOB POSTINGS IN
MANUFACTURING CALL FOR WORKERS TO
HAVE DEFINITELY DIGITAL (60 PERCENT)
OR LIKELY DIGITAL (93 PERCENT) SKILLS.
14 CLOSING THE DIGITAL SKILL DIVIDE: THE PAYOFF FOR WORKERS, BUSINESS, AND THE ECONOMY CLOSING THE DIGITAL SKILL DIVIDE: THE PAYOFF FOR WORKERS, BUSINESS, AND THE ECONOMY 15

THE PAYOFF OF CLOSING THE DIGITAL
SKILL DIVIDE
Despite the high demand for digital skills and the desire
for skill-building opportunities among workers, many
people have not had the opportunity to fully develop
such skills.
38
This lack of access to digital skill training
hits workers
39
and entrepreneurs
40
of color hardest.
Increasing public investments in digital skill building
can help individual workers increase their incomes,
allow businesses to thrive, and ultimately create
positive economic spillover effects for local, state, and
national economies.
Closing the digital skill divide would catapult
more workers into economic security.
At the individual level, previous research from NSC has
clearly established that having few or no foundational
digital skills is closely correlated with lower earnings.
41
This study provides new evidence that jobs requiring
digital skills have higher median wages than jobs that do
not. Workers who have opportunities to build in-demand
digital skills could potentially increase their earnings as
they acquire new skills.
42
If a worker who was previously employed in a job that
requires zero digital skills was able to move into a job
that requires a definitely digital skill, their hourly
wage would rise by 23 percent, or more than $8,000
per year, assuming both jobs paid the median hourly
wage for their respective skill levels.
43
This economic
bump would be significant for individual workers and
their families — and would be even higher if the worker
acquired additional digital skills, as shown in Figure 6.
It is not unusual for jobs to require numerous digital
skills; nearly a quarter (22 percent, or nearly ten million)
of all job postings analyzed for this study required at
least three different digital skills. Even the highest
end — jobs requiring at least nine different digital skills —
comprised 5 percent of total job postings, or roughly
2.1 million ads.
FIGURE 6: As more digital skills are required, median hourly wage rises (2021)
$19.05
$17.62
$18.00
$21.64
$25.50
$30.58
$37.92
$43.00
Overall
(all jobs)
Job requires
no digital
skills
Job requires
only likely
digital skills
Job requires
one definitely
digital skill
Job require
three definitely
digital skills
Job requires
five definitely
digital skills
Job requires
seven definitely
digital skills
Job requires
nine definitely
digital skills
IF A WORKER WHO WAS
PREVIOUSLY EMPLOYED IN
A JOB THAT REQUIRES ZERO
DIGITAL SKILLS WAS ABLE
TO MOVE INTO A JOB THAT
REQUIRES A DEFINITELY
DIGITAL SKILL, THEIR HOURLY
WAGE WOULD RISE BY 23
PERCENT, OR MORE THAN
$8,000 PER YEAR
14 CLOSING THE DIGITAL SKILL DIVIDE: THE PAYOFF FOR WORKERS, BUSINESS, AND THE ECONOMY CLOSING THE DIGITAL SKILL DIVIDE: THE PAYOFF FOR WORKERS, BUSINESS, AND THE ECONOMY 15

Investing in entry-level workers can help close
equity gaps.
As previously described, jobs that require no digital skills
offer substantially lower median wages than jobs that
do require such skills. Given this study’s finding that 94
percent of job ads seeking workers with a high school
diploma require digital or likely skills, as well as earlier
research documenting that workers with few or no digi-
tal skills are more likely to have low levels of education,
policymakers could prioritize upskilling these workers as
one element of closing equity gaps.
An analysis of The Census Bureau American Community
Survey data
44
shows that several of the “covered
populations” under the federal Digital Equity Act are
over-represented among workers with a high school
education or less, as shown in Figure 7. These workers
could benefit from focused investment in their digital
(and other) skills. (See Figure 7.)
Closing the digital skill divide would support
small businesses and aid business economic
vitality.
Businesses face numerous costs associated with the
digital skill divide, which could be reduced if more work-
ers had access to learning necessary skills. Specifically,
earlier research by NSC found that having a workforce
with insufficient access to digital skills functions as
an invisible drag on productivity, especially when the
people who lack digital skills are supervisors themselves,
because supervisors can serve as a bottleneck limiting
the productivity of other workers.
45
Public policy investments in workforce development and
education, such as the Digital Equity Act, are a key tactic
in addressing these challenges. Such policies are an
especially important support for small business, because
small businesses employ 47 percent of private-sector
workers,
46
and rely more heavily on publicly funded
FIGURE 7: Investing in workers with limited education could close equity gaps (2021)
13%
17%
19%
10%
11%
16%
15%
19%
16%
11%
15%
21%
13%
46%
44%
38%
20%
36%
Black
Latino
Immigrant
English learners
Persons with a disability
At or below 150% of poverty
% of all workers
age 25-64
% of workers whose highest
credential is a HS diploma
% of workers without
a HS diploma
16 CLOSING THE DIGITAL SKILL DIVIDE: THE PAYOFF FOR WORKERS, BUSINESS, AND THE ECONOMY CLOSING THE DIGITAL SKILL DIVIDE: THE PAYOFF FOR WORKERS, BUSINESS, AND THE ECONOMY 17

workforce development and education partners (rather
than in-house programs) to upskill employees.
In addition, state and federal programs that support
the upskilling of incumbent workers can foster busi-
ness vitality.
47
Prior research has shown that workers
value upskilling opportunities and prefer working for
employers who offer clear, well-defined pathways to
advancement.
48
Because turnover has heavy costs for
businesses — with estimates ranging from $25,000 for
workers who quit within the first year to over $78,000
for workers who quit after five years, averting or delay-
ing turnover by ensuring that workers have upskilling
opportunities can be economically significant.
49
Closing the digital skill divide would create
positive spillover effects for the broader
economy.
Public investments in closing the digital skill divide
can also generate economic benefits for the broader
economy. As noted above, people who qualify for jobs
that require even one digital skill can earn an average of
$8,000 more per year than those working in jobs requir-
ing no digital skills.
50
These increased earnings could result in more state
and federal tax revenue generated by each worker.
Depending on the household size and composition, this
could range from $1,363 to $2,879 per year, as illus-
trated in Figure 8.
51
(Note: The states chosen here for
illustrative purposes, North Carolina and Illinois, are also
profiled in detail in the Appendix of this report.)
All of this increased economic activity for workers and
businesses would have additional positive spillover
effects for the communities in which they are located.
As workers earn more money, they are able to purchase
additional goods and services. As businesses increase
their revenue and profits, they are able to invest fur-
ther in expansion, pay dividends to shareholders, and
increase wages.
FIGURE 8: Increased economic impact (combined Federal and State tax revenue) generated if workers move
from a job that requires no digital skills to a job that requires one digital skill
52
Household composition
Increased economic impact:
NORTH CAROLINA
Increased economic impact:
ILLINOIS
Single Adult, No Children $1,387 per year $1,363 per year
Single Adult, One Child $2,693 per year $2,879 per year
Two Adults, No Children $2,774 per year $2,726 per year
Two Adults, Two Children $2,816 per year $2,726 per year
Note: Calculations in this table assume each working adult is earning the median hourly wage as described above, and working 40
hours per week, 50 weeks per year.
BECAUSE TURNOVER HAS HEAVY
COSTS FOR BUSINESSES — WITH
ESTIMATES RANGING FROM $25,000
TO $78,000 — AVERTING OR DELAYING
TURNOVER BY ENSURING THAT WORKERS
HAVE UPSKILLING OPPORTUNITIES CAN
BE ECONOMICALLY SIGNIFICANT.
16 CLOSING THE DIGITAL SKILL DIVIDE: THE PAYOFF FOR WORKERS, BUSINESS, AND THE ECONOMY CLOSING THE DIGITAL SKILL DIVIDE: THE PAYOFF FOR WORKERS, BUSINESS, AND THE ECONOMY 17

RECOMMENDATIONS
T
he findings outlined in this report are clear and unequivocal: The labor market is moving quickly
and inexorably toward greater digital skills requirements across every industry and nearly every
occupation. At the same time, the impact of the digital skill divide disproportionately falls on some
workers, including workers of color and those without education beyond high school.
Ensuring that public investments are intentionally focused to remedy inequities facing individuals and
communities is vital to the economic success of states and the country as a whole.
53
As the federal Digital
Equity Act (part of the Infrastructure Investment and Jobs Act passed by Congress in 2021) is imple-
mented in states, policymakers will have a powerful opportunity to close gaps in racial, gender, age and
geographic equity. Similarly, as officials work to update landmark policies such as WIOA and other work-
force and education policies, it is crucial to incorporate the latest findings on how to close the digital skill
divide.
Given the findings laid out in this report, there are three overarching recommendations to guide leaders’
decisionmaking:
A DIGITAL SKILL FOUNDATION FOR ALL.
All workers need the opportunity to develop broad-based, flexible, digital problem-solving skills for
current technologies and ongoing technological shifts.
Policymakers can support this goal by ensuring that policies targeting workers’ access to digital skills
meet workers — and the education and workforce development system — where they are. In particular,
policymakers can use federal Digital Equity Act and Broadband Equity, Access, and Deployment (BEAD)
funds to improve access to free or low-cost digital skills training for workers, and to ensure that workforce
development and education providers are equipped to provide high-quality upskilling services. This should
include providing high-quality professional development and technical assistance to aid workforce and
education providers in designing demand-driven digital skill-building programs.
Workforce and education advocates and providers can support this goal by speaking up for digital equity
investments that support people’s goals and aspirations, and helping policymakers connect the dots from
federal policies to specific opportunities in their own states and localities.
For example, providers may have gathered valuable data on the digital skill needs of workers and busi-
nesses that can inform policy implementation. In particular, individuals often identify “getting a job” or
“getting a better job” as their primary reason for enrolling in skill-building opportunities. Similarly, provid-
ers have often developed robust relationships with small businesses and industry sector partnerships that
can help identify opportunities to support individuals’ digital skill-building aspirations while also respond-
ing to local labor market demand.
Corporate decisionmakers and influencers can use their platforms to ensure that skills are central to
digital divide discussions in the public and policymaking spheres. The data provided in this report can help
to amplify opportunities in particular industries as well as to shift public conversation more generally to
include a skills lens.
18 CLOSING THE DIGITAL SKILL DIVIDE: THE PAYOFF FOR WORKERS, BUSINESS, AND THE ECONOMY CLOSING THE DIGITAL SKILL DIVIDE: THE PAYOFF FOR WORKERS, BUSINESS, AND THE ECONOMY 19

ONGOING UPSKILLING FOR EVERY WORKER IN EVERY WORKPLACE.
Workers in every industry need the opportunity to develop industry- and occupation-specific digital
skills to adapt and advance in their careers.
Policymakers can support this goal by investing in industry sector partnerships
54
that can collaborate
with community colleges and other training providers to ensure that the talent development process is
connected to industry-specific skill needs and jobs. These partnerships can be specifically designed to
help close racial, gender, and other equity gaps
55
that have served to limit some workers’ access to jobs
that require technology skills.
Workforce and education advocates and providers can encourage policymakers to embed digital
problem-solving skills as allowable or required activities under existing workforce development, adult
education, and higher education policies, as well as digital equity
56
policies. For example, 30 states have
incumbent worker training funds that could be used to support digital skill building.
57
Corporate decisionmakers and influencers can implement policies and practices that support digital
upskilling for workers at every level of their organizations. Smaller businesses can participate in regional
industry partnerships that support these efforts across small businesses at scale.
RAPID RESKILLING FOR RAPID RE-EMPLOYMENT.
We need to be ready for sudden disruptions to the labor market or specific industries. Policies should
support rapid reskilling so workers can move from one industry to another.
Policymakers can support this goal by supporting access to skills for workers who have lost their jobs,
including those transitioning to a new industry. This includes ensuring that student financial aid policies
match the reality of how digital skills are acquired. This could entail increasing financial aid for compe-
tency-based programs. Policies could also support enrollment in high quality, short-term programs that
lead to employment and articulate to further educational pathways. These two solutions would create
meaningful on-ramps for individuals who might otherwise never pursue postsecondary credentials. It
could also include providing workers with the supports necessary to succeed in a training program — sup-
porting costs of childcare, transportation and other costs associated with job loss that can stand in the
way of someone being able to access the skill-building opportunity they need.
Workforce and education advocates and providers can support this goal by sharing their expertise with
policymakers and answering questions such as: What has your organization observed regarding digital
skill needs among staff, jobseekers, and learners? What policies have been most helpful in addressing
digital skill needs? What policies are getting in the way of addressing digital skill needs? What strategies
and tactics have been most effective in closing racial equity gaps in access to digital skills?
Influencers and corporate decisionmakers can educate state and federal policymakers about the skills
mismatches they are experiencing and the kinds of technology skills their companies need to be success-
ful, which some elected officials may not fully understand. Promoting state and federal public policies
that support the development of industry partnerships provides another avenue for employers to help
build training programs in collaboration with local community colleges and training providers.
18 CLOSING THE DIGITAL SKILL DIVIDE: THE PAYOFF FOR WORKERS, BUSINESS, AND THE ECONOMY CLOSING THE DIGITAL SKILL DIVIDE: THE PAYOFF FOR WORKERS, BUSINESS, AND THE ECONOMY 19

ENDNOTES
1 The research team for this report analyzed 43 million online job
postings published in 2021 and collected by Lightcast (formerly
known as Emsi Burning Glass). Across all ads, there were 15,000
distinct skills. The research team manually coded the top 50
percent of these skills — that is, the 7,500 skills that were most
often requested in job ads. (Notably, however, this top 50 percent
accounted for 99.99% of job ads.) The team coded each skill
according to whether it was definitely digital, likely digital, or not
digital. This coding formed the basis for the original analysis and
findings in this report.
2 The team coded each skill according to whether it was definitely
digital, likely digital, or not digital. Knowledge of Salesforce
software or the Python programming language were coded as defi-
nitely digital. An example of a likely digital skill would be survey
design or bookkeeping — tasks that today are frequently accom-
plished with the use of a computer or other digital device, but could
still be carried out in an old-fashioned analog fashion. An example
of a not digital skill is changing diapers.
3 The New Landscape of Digital Literacy (National Skills Coalition,
2020.)
4 “How to improve the engagement and retention of young hourly
workers,” Kimberly Gilsdorf et al. (Harvard Business Review,
December 6, 2017.)
5 Roberts, Pasha. “The CFO and CHRO Guide to Employee Attrition.”
Workforce Solutions Review 6, no. 1 (January 2015): 8–10.
6 As detailed later in this report, in the Lightcast dataset used for this
analysis, jobs that require no digital skills had an average median
hourly wage of $17.62, compared to $21.64 for jobs that require one
definitely digital skill.
7 Feenberg, Daniel Richard, and Elizabeth Coutts, An Introduction
to the TAXSIM Model, Journal of Policy Analysis and Management
vol 12 no 1, Winter 1993, pages 189-194. Shane Orr (2022). usincom-
etaxes: Calculate Federal and State Income Taxes in the United
States. R package version 0.5.4. https://cran.r-project.org/
package=usincometaxes
8 Learn more about the Digital Equity Act’s covered populations via
the U.S. Commerce Department’s official InternetForAll.gov site,
and NSC’s fact sheet.
9 The Roadmap to Racial Equity: An Imperative for Workforce
Development Advocates. (National Skills Coalition, 2019.)
10 Learn more about industry sector partnerships in the Sector
Partnerships Policy Toolkit (National Skills Coalition, 2015) and on
the NSC website.
11 For example, see Expanding Digital Inclusion via the Bipartisan
Infrastructure Law (National Skills Coalition, 2022.)
12 Applying a Racial Equity Lens to Digital Literacy (National Skills
Coalition, 2020.)
13 This definition builds on the definition of the digital divide used
by the nonprofit National Digital Inclusion Alliance, viewable at:
https://www.digitalinclusion.org/definitions/
14 The nonprofit Digital US coalition defines digital resilience as:
“having the awareness, skills, agility, and confidence to be empow-
ered users of new technologies and adapt to changing digital skill
demands. Digital resilience improves capacity to problem-solve and
upskill, navigate digital transformations, and be active participants
in society and the economy.”
15 The New Landscape of Digital Literacy (National Skills Coalition,
2020.)
16 Examples of such inequities include digital redlining that limits
the availability of high-speed internet in some communities;
under-funded educational institutions that are unable to provide
their students with robust digital technologies for learning; and
barriers to access that limit students’ and workers’ ability to
build digital skills and businesses’ ability to advance into the dig-
ital age. In addition, limited income and limited access to capital
handicaps digital access and skill-building opportunities, often
exacerbated by the wealth gap and disproportionately affecting
workers and entrepreneurs of color.
17 For more on the role of public policy in remedying inequities, see
The Roadmap to Racial Equity: An Imperative for Workforce
Development Advocates (National Skills Coalition, 2019.)
18 The New Landscape of Digital Literacy (National Skills Coalition,
2020.)
19 Frequently Asked Questions (U.S. Small Business Administration,
October 2020.)
20 “How to improve the engagement and retention of young hourly
workers,” Kimberly Gilsdorf et al. (Harvard Business Review,
December 6, 2017.)
21 Roberts, Pasha. “The CFO and CHRO Guide to Employee
Attrition.” Workforce Solutions Review 6, no. 1 (January 2015):
8–10.
22 As detailed later in this report, in the Lightcast dataset used for
this analysis, jobs that require no digital skills had an average
median hourly wage of $17.62, compared to $21.64 for jobs that
require one definitely digital skill.
23 Feenberg, Daniel Richard, and Elizabeth Coutts, An Introduction
to the TAXSIM Model, Journal of Policy Analysis and Management
vol 12 no 1, Winter 1993, pages 189-194. Shane Orr (2022).
usincometaxes: Calculate Federal and State Income Taxes in the
United States. R package version 0.5.4. https://cran.r-project.org/
package=usincometaxes
24 Learn more about the Digital Equity Act’s covered populations via
the U.S. Commerce Department’s official InternetForAll.gov site,
and NSC’s fact sheet.
25 For a full listing of state demand for digital skills, see the
Appendix.
26 The Lightcast dataset used for this report also includes some
job postings that required workers to have zero to two years of
experience in a particular role; those workers might not be new
entrants to the workforce at large.
27 Note for this figure: Data refers to the subset of 24 million job ads
(out of the total 43 million in this study) for which Lightcast was
able to discern an educational level.
28 The New Landscape of Digital Literacy (National Skills Coalition,
2020.)
29 It is unclear from this dataset whether higher-level jobs are genu-
inely less likely to require foundational skills, or simply less likely
to spell them out in their job descriptions. Preliminary indications
from qualitative interviews suggest that employers may assume
that workers with greater education have acquired basic digital
competence — even if that assumption is not always borne out in
reality — and thus do not bother to spell out the requirement in a
job description.
20 CLOSING THE DIGITAL SKILL DIVIDE: THE PAYOFF FOR WORKERS, BUSINESS, AND THE ECONOMY CLOSING THE DIGITAL SKILL DIVIDE: THE PAYOFF FOR WORKERS, BUSINESS, AND THE ECONOMY 21

30 Qualitative interviews conducted by NSC suggest that part of the
story here is that smaller and more economically fragile businesses
are slower to digitize, meaning that their ‘likely digital’ tasks (such
as order processing or inventory management) may still be manual
or analog, while larger and better-resourced businesses have
already moved those functions to software systems.
31 Notably, this is only an approximate measure, because there is
substantial variation in the “churn” rate of turnover across different
companies and industries, and thus the volume of job postings that
might be posted in a given time period.
32 Boosting Digital Literacy in the Workplace (National Skills
Coalition, 2020.)
33 Demographic data throughout this section comes from the U.S.
Census Bureau American Community Survey 5-year estimates
(2016-2020.)
34 For example, see: The Evolution of Occupational Segregation in
the United States, 1940–2010: Gains and Losses of Gender–Race/
Ethnicity Groups (Demography, 2015); The extent of occupational
segregation in the US: Differences by race, ethnicity, and gender
(Society for the Study of Economic Inequity, 2010); and Racism
and the Economy: Focus on Employment (Federal Reserve Bank of
Atlanta, 2020.)
35 Community Health Worker National Workforce Survey (U.S.
Department of Health and Human Services, 2007.)
36 Demographic data comes from the U.S. Census Bureau American
Community Survey 5-year estimates (2016-2020.)
37 The New Landscape of Digital Literacy (National Skills Coalition,
2020.)
38 Applying a Racial Equity Lens to Digital Literacy (National Skills
Coalition, 2020.)
39 Multiple factors combine to create these challenges. For example,
Black and Latino workers are less likely to have bachelor’s degrees,
and employers invest 58 percent of their upskilling dollars in work-
ers at that educational level, compared to just 17 percent of training
dollars provided to workers with high school diplomas or less. See
Training: The Role of Employer-Provided Training in the American
Postsecondary Education and Training System (Georgetown
University Center on Education and the Workforce, 2015). For
more on related issues, see Applying a Racial Equity Lens to
Digital Literacy (National Skills Coalition, 2020) and The Roadmap
to Racial Equity: An Imperative for Workforce Development
Advocates (National Skills Coalition, 2019.)
40 For an example of the disproportionate headwinds faced by entre-
preneurs of color, see: “Which small businesses are most vulnera-
ble to COVID-19—and when” (McKinsey & Company, June 18, 2020.)
41 Earlier research conducted by National Skills Coalition (The New
Landscape of Digital Literacy, 2020) found that fully 31 percent
of employed U.S. adults had few or no foundational digital skills.
Workers without digital skills had lower incomes and less formal
education compared to peers with stronger digital skills. Because
this data was drawn from the Survey of Adult Skills (also known
as the PIAAC), it reflects a direct, actual test of workers’ skills, not
merely a self-reported survey or other indirect measure. Additional
informal research conducted since the pandemic — including qual-
itative interviews with employers as well as direct assessment of
incumbent workers using the Northstar Digital Literacy Assessment
— indicates that the 31 percent number may even be conservative.
Workers reported spending significant time and effort covering for
and compensating for their digital skill gaps.
42 It is important to note that correlation is not causation. Simply
acquiring a digital skill is not a guarantee that a worker will be able
to move into a better-paying job. However, research indicates that
in general, workers with greater skills are indeed able to command
more opportunities in the labor market. In addition, earlier research
has shown that the U.S. generally has stronger returns to foun-
dational skills than other developed countries. Returns to Skills
Around the World: Evidence from the PIAAC. (Hoover Institution,
2013.)
43 Median wage of $17.62 an hour for jobs with no digital skills com-
pared to $21.64 an hour for jobs requiring a definitely digital skill.
Calculation assumes full-time, year-round employment of 40 hours
a week, 50 weeks a year.
44 All data in this section comes from the American Community
Survey 2016-2020 five-year estimates.
45 NSC’s research found that between one-fifth and one-third of
people with few or no foundational digital skills are nevertheless
supervising other workers. See: The New Landscape of Digital
Literacy (National Skills Coalition, 2020.)
46 Frequently Asked Questions (U.S. Small Business Administration,
October 2020.)
47 Funding Resilience (National Skills Coalition, 2021.)
48 “How to improve the engagement and retention of young hourly
workers,” Kimberly Gilsdorf et al. (Harvard Business Review,
December 6, 2017.)
49 Roberts, Pasha. “The CFO and CHRO Guide to Employee Attrition.”
Workforce Solutions Review 6, no. 1 (January 2015): 8–10.
50 In the Lightcast dataset used for this analysis, jobs that require no
digital skills had an average median hourly wage of $17.62, com-
pared to $21.64 for jobs that require one definitely digital skill.
51 Feenberg, Daniel Richard, and Elizabeth Coutts, An Introduction
to the TAXSIM Model, Journal of Policy Analysis and Management
vol 12 no 1, Winter 1993, pages 189-194. Shane Orr (2022). usincom-
etaxes: Calculate Federal and State Income Taxes in the United
States. R package version 0.5.4. https://cran.r-project.org/
package=usincometaxes
52 Ibid. Note also: Tax liabilities are estimated based on rule year 2022.
Federal tax liabilities represent total taxes minus applicable tax
credits for a household (Child Tax Credit and Earned Income Tax
Credit).
53 The Roadmap to Racial Equity: An Imperative for Workforce
Development Advocates (National Skills Coalition, 2019.)
54 Learn more about industry sector partnerships in the Sector
Partnerships Policy Toolkit (National Skills Coalition, 2015) and on
the NSC website.
55 The Roadmap to Racial Equity: An Imperative for Workforce
Development Advocates (National Skills Coalition, 2019.)
56 For example, see, Expanding Digital Inclusion via the Bipartisan
Infrastructure Law (National Skills Coalition, 2022.)
57 Funding Resilience (National Skills Coalition, 2021.)
20 CLOSING THE DIGITAL SKILL DIVIDE: THE PAYOFF FOR WORKERS, BUSINESS, AND THE ECONOMY CLOSING THE DIGITAL SKILL DIVIDE: THE PAYOFF FOR WORKERS, BUSINESS, AND THE ECONOMY 21

22 CLOSING THE DIGITAL SKILL DIVIDE: THE PAYOFF FOR WORKERS, BUSINESS, AND THE ECONOMY CLOSING THE DIGITAL SKILL DIVIDE: THE PAYOFF FOR WORKERS, BUSINESS, AND THE ECONOMY 23

OVERVIEW
The national data presented in this report has powerful implications for state officials and workforce and
education advocates. In this appendix, NSC and the Federal Reserve Bank of Atlanta have included two charts
that illustrate the demand for digital skills by state, using the same Lightcast data set that was used in our
full report.
However, because the fifty states vary significantly in factors such as the economic mix of their industries
and the demographic makeup of their workforce, state stakeholders may find it helpful to juxtapose these
national findings with additional, more state-specific analysis.
State leaders have a wealth of resources they can call upon to carry out such analyses, including Labor
Market Information (LMI) agencies, labor departments, and state workforce development boards. Nonprofit
policy advocacy organizations, universities, and research institutes may also have expertise and interest in
conducting such analyses.
To illustrate how states might go about this, NSC and the Federal Reserve Bank of Atlanta have collaborated
to produce sample profiles for two states — North Carolina and Illinois — that are included in this appendix.
These state profiles can serve multiple purposes. In particular, they can:
■
Help states identify where to target digital skill-building investments. The bipartisan infrastructure
law passed by Congress in 2021 included major new investments for states via the Digital Equity Act,
which provides $2.75 billion in federal funding to support digital inclusion programs. As states develop the
required Digital Equity Plans that will form the roadmap for these investments, this data can help inform
their efforts.
■
Help states identify where more information or research is needed. State leaders can use this data as
a starting point for discovering more about particular industries’ need for technologically skilled workers,
and how they might target upskilling resources to remedy inequities among demographic groups.
GUIDING QUESTIONS FOR STATES TO CONSIDER
As states are analyzing this data to address digital skills needs and implement new digital equity investments,
there are some questions that can help to frame their analysis. In particular, policymakers and advocates
may wish to consider:
■
What particular barriers do specific demographic groups of workers (including those defined as “covered
populations” in the Digital Equity Act) face in your state?
■
How might investments inadvertently exacerbate inequities facing these workers? How might investments
be better targeted to avoid worsening (and instead to improve) inequities?
■
What non-public data on digital access or skills are available to inform state decision making? (For exam-
ple, does the state collect information on whether Unemployment Insurance claimants access the system
via telephone versus the internet?)
■
How can this data be leveraged to better illuminate challenges and opportunities?
APPENDIX:
SELECTED STATE PROFILES
22 CLOSING THE DIGITAL SKILL DIVIDE: THE PAYOFF FOR WORKERS, BUSINESS, AND THE ECONOMY CLOSING THE DIGITAL SKILL DIVIDE: THE PAYOFF FOR WORKERS, BUSINESS, AND THE ECONOMY 23

DIGITAL SKILL DEMANDS ACROSS STATES
The demand for digital skills varies somewhat by state. As illustrated in Figure 1, job postings across all states
and territories show high demand for workers with likely digital skills, ranging from Montana at 88 percent
to the District of Columbia at 95 percent. There are greater differences among the subset of job postings
requiring a definitely digital skill, from a low of 39 percent of job postings in Indiana to a high of 66 percent
in D.C.
FIGURE 1: Demand for digital skills by state/territory, by percent of jobs requiring a likely digital skill
State/Territory
Percent of
job postings
including a
likely digital
skill
Percent of
job postings
including a
definitely
digital skill
District of Columbia 95% 66%
Puerto Rico 94% 53%
Hawaii 93% 47%
Alaska 93% 47%
Massachusetts 92% 51%
Maryland 92% 51%
Wyoming 92% 47%
New York 92% 52%
Virginia 92% 53%
New Mexico 92% 45%
Connecticut 91% 46%
Washington 91% 49%
California 91% 51%
Texas 91% 49%
Delaware 91% 48%
Utah 91% 51%
Colorado 91% 47%
West Virginia 91% 42%
Arizona 91% 47%
South Dakota 91% 42%
North Dakota 91% 44%
North Carolina 91% 46%
South Carolina 91% 42%
Minnesota 91% 48%
Louisiana 90% 41%
New Hampshire 90% 43%
State/Territory
Percent of
job postings
including a
likely digital
skill
Percent of
job postings
including a
definitely
digital skill
New Jersey 90% 49%
Pennsylvania 90% 45%
Illinois 90% 47%
Kansas 90% 45%
Rhode Island 90% 48%
Missouri 90% 46%
Georgia 90% 48%
Oregon 90% 47%
Nevada 90% 45%
Tennessee 90% 43%
Nebraska 90% 45%
Mississippi 90% 41%
Florida 90% 44%
Maine 90% 44%
Oklahoma 90% 45%
Kentucky 90% 42%
Iowa 90% 43%
Idaho 90% 43%
Alabama 90% 41%
Vermont 89% 42%
Michigan 89% 45%
Ohio 89% 44%
Indiana 89% 39%
Wisconsin 89% 42%
Arkansas 89% 42%
Montana 88% 48%
Source: FRB/NSC analysis of Lightcast data.
24 CLOSING THE DIGITAL SKILL DIVIDE: THE PAYOFF FOR WORKERS, BUSINESS, AND THE ECONOMY CLOSING THE DIGITAL SKILL DIVIDE: THE PAYOFF FOR WORKERS, BUSINESS, AND THE ECONOMY 25

NORTH CAROLINA
THE BIG PICTURE: UNDERSTANDING THE DEMAND FOR DIGITAL SKILLS
North Carolina is one of the larger southern states by both population and economic activity. There are
about 10.6 million people in North Carolina, and its GDP
1
was $660 billion in 2021. The median household
income
2
is about $57,000. White, Black, and American Indian and Alaska Native people are overrepresented
in the state compared to national averages, while Latinos and Asian American and Pacific Islanders are
underrepresented.
North Carolina has strong demand for workers with technology skills. In the Lightcast dataset of 2021 job
postings used for this analysis,
3
there were almost 1.5 million postings for jobs located in the state. Among
those job ads, 670,000, or 46 percent, required at least one definitely digital skill, and 91 percent required a
definitely or likely digital skill. (These numbers are consistent with the national averages of 47 percent and
92 percent, respectively.)
ZOOMING IN: DIGITAL SKILL DEMANDS DIFFER BY INDUSTRY
Perhaps unsurprisingly, foundational skills such as spreadsheets, data entry, typing, and “basic internet
skills” are widely required across all industries in North Carolina. But when it comes to more sophisticated
skills, there are notable differences by sectors. For example, many job postings in the real estate industry
require familiarity with Yardi software, while a surprisingly high number of ads in the retail trade sector
seek people with robotics expertise. In manufacturing, employers are looking for workers with Enterprise
Resource Planning (ERP) software skills, while in accommodation and food services, Lotus Domino is in
frequent demand. In the utility sector, Global Positioning System (GPS) and SCADA (supervisory control and
data acquisition) system skills are crucial.
Knowing which digital skills are broadly in demand throughout an industry sector — or are transferrable
across different industries — can help stakeholders to make wise decisions about where to invest time and
resources. State policymakers and workforce and education advocates can stress-test workforce program
designs against on-the-ground data from employers and job postings to ensure a clear connection between
training programs’ focus and the skills workers will need on the job.
The Lightcast dataset also reveals some occupations where demand in North Carolina is especially acute.
The roles highlighted in Figure 2 do not require a bachelor’s degree, and therefore could be valuable
opportunities for workers with more limited education who are seeking to build their digital skills and obtain
higher-wage employment.
1 Gross Domestic Product: All Industry Total in North Carolina, U.S. Bureau of Economic Analysis, retrieved from FRED, Federal
Reserve Bank of St. Louis (2022)
2 QuickFacts: North Carolina, U.S. Census Bureau (2022)
3 For more information on this dataset, see the full report: Closing the Digital Skill Divide: The Payoff for Workers, Business, and the
Economy.
24 CLOSING THE DIGITAL SKILL DIVIDE: THE PAYOFF FOR WORKERS, BUSINESS, AND THE ECONOMY CLOSING THE DIGITAL SKILL DIVIDE: THE PAYOFF FOR WORKERS, BUSINESS, AND THE ECONOMY 25

FIGURE 2: Top sub-baccalaureate occupations in North Carolina with high demand for digital skills
(2021)
Occupation
Total job
postings
Subset of
job postings
requesting
definitely
digital skills
Percent of
job postings
requiring
definitely
digital skills
Software Developer / Engineer 1,413 1,335 94%
Computer Support Specialist 2,825 2,626 93%
Bookkeeper / Accounting Clerk 3,754 3,294 88%
Human Resources / Labor Relations Specialist 1,558 1,329 85%
Radiologic Technician / Technologist 1,018 865 85%
Personal Banker / Banking Sales Staff 2,340 1,968 84%
Office / Administrative Assistant 11,204 9,272 83%
Loan Officer 1,075 866 81%
Paralegal / Legal Assistant 1,004 806 80%
Security Officer 10,136 8,067 80%
Source: FRB/NSC analysis of Lightcast data.
Note: Analysis limited to occupations that Lightcast shows as requiring a high school diploma/equivalent or an associate degree.
Occupations that had fewer than 1,000 total job posts in the 2021 Lightcast dataset were omitted.
Consistent with national findings, these in-demand North Carolina jobs typically require both foundational and
industry-specific digital skills. For example, both Microsoft Excel (a foundational skill) and the more specialized
accounting software QuickBooks are frequently listed in job ads for bookkeeper/accounting clerk positions.
In job postings for security officers, basic “computer literacy” is the most-requested skill by far. But these job
ads also call for a range of more sophisticated skills, from surveillance system monitoring to IBM Cloud to
Microsoft Azure.
Digital skills in real life: What skills look like on the job
Knowing how digital skills are showing up in the real world can help state leaders and other stakeholders to
connect the dots between workforce and education investments, talent development pipelines, and business
vitality. Below, selected major North Carolina industry sectors are highlighted with examples.
26 CLOSING THE DIGITAL SKILL DIVIDE: THE PAYOFF FOR WORKERS, BUSINESS, AND THE ECONOMY CLOSING THE DIGITAL SKILL DIVIDE: THE PAYOFF FOR WORKERS, BUSINESS, AND THE ECONOMY 27

Manufacturing
Nearly 650,000 North Carolinians work in the manufacturing sector. Manufacturing workers in the state
are disproportionately likely to be Black, Latino, or Asian compared to the overall workforce in North
Carolina. Manufacturing workers are also more likely to have limited educational attainment of a high
school diploma (or less), more likely to live in rural areas, and to have limited proficiency in English.
4
While roles such as CNC operator or Programmable Logic Control (PLC) technician have long required
some degree of digital skills, the transformation to Industry 4.0
5
is driving increased digital adoption
in companies large and small. Manufacturing companies today are increasingly seeking workers with
expertise in areas as diverse as robotics, AutoCAD, Human-Machine Interface, data analysis, and the SQL
programming language.
One recent survey showed that the percentage of advanced manufacturing companies adopting
Industry 4.0 technologies doubled between 2020 and 2021,
6
a rapid rate of increase that coincided with
the beginning of the Covid pandemic. In particular, the number of companies using 3D printing tech-
nology grew from 24 percent to 39 percent, and the number using collaborative robots grew from 6
percent to 22 percent.
Construction
Construction is a major industry in the state, employing more than 375,000 people. Construction workers
in the state are disproportionately likely to be Latino or American Indian or Alaska Native when com-
pared to the overall workforce in North Carolina. Construction workers also more likely to have limited
educational attainment of a high school diploma (or less), more likely to live in rural areas, and to have
limited proficiency in English.
7
A recent national survey of construction industry leaders found that 91 percent reported using their
smartphones daily for work purposes. Sixty-one percent said they used at least three different construc-
tion apps — such as Procore or Bluebeam Revu — for tasks such as daily reporting, safety management,
Building Information Modeling (BIM) file viewing, and tool tracking.
8
An interview conducted by NSC with a construction company executive in a large southern state illus-
trates how even frontline workers’ jobs have changed to require more digital skills. “Over the past few
years, almost all of our [general contractor] customers have shifted to using digital blueprints,” explains
the executive. “If we as the subcontractor notice a problem on the building site, we have to submit a
Request for Information (RFI) to the general contractor to ask about the conflict.” Workers have to be
able to spot a problem on site, take a photo, and immediately submit an RFI.
The shift to digital blueprints caused a cascade effect, says the executive. “We quickly realized that it
meant that our frontline workers needed to have iPads and e-mail access so they could communicate
with the general contractors.” It was a substantial shift, especially given that many of the company’s
frontline workers are navigating English-language software programs without necessarily being fluent in
English themselves and are often working on far-flung job sites with spotty or no internet access.
4 FRB/NSC analysis of 2016-2020 American Community Survey data accessed via IPUMS-USA, University of Minnesota, www.ipums.org.
5 For more information, see https://www.sap.com/insights/what-is-industry-4-0.htm
6 For more information, see: https://www.conexusindiana.com/2022/01/
new-study-tech-adoption-among-indiana-advanced-manufacturers-more-than-doubles-from-2020-to-2021/
7 FRB/NSC analysis of 2016-2020 American Community Survey data accessed via IPUMS-USA, University of Minnesota, www.ipums.org.
8 Construction Technology Report, 10th edition. (JB Knowledge, 2021.)
26 CLOSING THE DIGITAL SKILL DIVIDE: THE PAYOFF FOR WORKERS, BUSINESS, AND THE ECONOMY CLOSING THE DIGITAL SKILL DIVIDE: THE PAYOFF FOR WORKERS, BUSINESS, AND THE ECONOMY 27

Healthcare
More than 720,000 workers in North Carolina are employed in the healthcare sector. Compared to the
overall North Carolina workforce, healthcare workers are disproportionately Black, and they are also
more likely to be women and to have college degrees.
9
While electronic medical records have been a feature of the landscape for more than a decade, the pan-
demic kicked other aspects of the industry’s digital transformation into high gear. Interviews and previous
research conducted by NSC have highlighted some common digital skill demands on the job. For example,
home health workers in the field often use tablet computers to track their hours, log patient vital signs,
and communicate with higher level medical specialists about patient care.
At health clinics, reception desk workers increasingly have the responsibility of assisting patients in
installing, using, and troubleshooting telehealth services. In hospitals and other institutional settings,
workers in non-clinical jobs have had to adapt to more digitally driven processes in procurement and
compliance.
PUTTING THIS DATA TO WORK: RESOURCES FOR
STATE DIGITAL EQUITY PLANNING
As noted above, states are now engaged in their federally required development of 5-year Digital Equity Act
plans and 5-year Broadband Equity, Access, and Deployment (BEAD) Action Plans.
State Digital Equity Plans must describe how states will close the digital skill divide for the following
populations:
■
Low-income individuals;
■
Aging individuals;
■
Veterans;
■
Individuals with disabilities;
■
Individuals with English language barriers;
■
Individuals with limited literacy skills;
■
People of color;
■
Individuals living in rural areas; and
■
Individuals currently incarcerated (in non-federal correctional facilities).
In this section, we highlight data sources that states can use to better understand each population. By
juxtaposing this Census Bureau American Community Survey with our Lightcast findings, states can better
identify where to focus their digital skill-building investments.
Low-income individuals
As described in the full Closing the Digital Skill Divide report, low-income individuals face significant chal-
lenges in building their digital skills and are disproportionately likely to need such skills.
Fifteen percent of North Carolinians aged sixteen to sixty-four live in households that are at or below 150
percent of the poverty line. While that number is already high, it’s even higher for the subset of individuals
working
10
in certain industries. For example, it rises to 29 percent for workers in the accommodation and food
services sector, 25 percent for workers in the administrative and support and waste management and reme-
diation services, and 20 percent for individuals in the construction sector.
9 FRB/NSC analysis of 2016-2020 American Community Survey data accessed via IPUMS-USA, University of Minnesota, www.ipums.org.
10 In our industry analyses, we’ve excluded workers who are active military or whose last industry was in the military. For individuals
who are not currently working, the data reflect the industry in which they were most recently employed.
28 CLOSING THE DIGITAL SKILL DIVIDE: THE PAYOFF FOR WORKERS, BUSINESS, AND THE ECONOMY CLOSING THE DIGITAL SKILL DIVIDE: THE PAYOFF FOR WORKERS, BUSINESS, AND THE ECONOMY 29

29%
27%
25%
20%
20%
20%
15%
15%
14%
14%
13%
11%
11%
9%
9%
8%
6%
6%
5%
5%
5%
Accommodation and Food Services
Agriculture, Forestry, Fishing and Hunting
Admin and Support and Waste Management
Other Services (except Public Administration)
Construction
Retail Trade
North Carolina Average (all industries)
Arts, Entertainment, and Recreation
Manufacturing
Transportation and Warehousing
Health Care and Social Assistance
Real Estate and Rental and Leasing
Wholesale Trade
Educational Services
Mining, Quarrying, and Oil and Gas Extraction
Information
Management of Companies and Enterprises
Professional, Scientific, and Technical Services
Public Administration
Utilities
Finance and Insurance
Source: FRB/NSC analysis of 2016-2020 American Community Survey data accessed via IPUMS-USA, University of Minnesota, www.ipums.org
This data is particularly notable because there is strong demand for workers with digital skills in these indus-
tries, which signals that North Carolina has two reasons to invest in these workers: First, to support their
individual economic mobility and meet requirements under the Digital Equity Act, and second, to ensure that
the the state workforce is equipped to meet the growing demand for technological skills in these industries.
Nationwide, 23 percent of accommodation and food services, 49 percent of administrative and support and
waste management, and 39 percent of construction job postings required at least one definitely digital skill.
FIGURE 3: Percent of North Carolinians aged 16-64 living in low income households, by Industry of
Employment
28 CLOSING THE DIGITAL SKILL DIVIDE: THE PAYOFF FOR WORKERS, BUSINESS, AND THE ECONOMY CLOSING THE DIGITAL SKILL DIVIDE: THE PAYOFF FOR WORKERS, BUSINESS, AND THE ECONOMY 29

Aging individuals
In general, aging populations have slightly lower levels of digital skills than younger populations,
11
so they
should be considered when developing community-centric programs. Focusing on digital skills during tra-
ditional years of education (K-12 and young adulthood) is insufficient. Adult workers need timely, relevant
education and workforce development opportunities at mid-career and later in their working years, as their
jobs continue to change beneath their feet.
In North Carolina, 9 percent of working age individuals are aged between sixty and sixty-four. The agriculture,
forestry, fishing and hunting sector and the utilities industry have disproportionate numbers of older work-
ers. Older workers are also more likely to live in non-metro or mixed (metro and non-metro) areas.
12
FIGURE 4: Percent of North Carolinians aged 60-64, by Industry of Employment
Industry Percent of working-age
adults 60 or above
Utilities 16%
Real Estate and Rental and Leasing 12%
Mining, Quarrying, and Oil and Gas Extraction 11%
Public Administration 11%
Agriculture, Forestry, Fishing and Hunting 11%
Manufacturing 11%
Educational Services 11%
Transportation and Warehousing 10%
Management of Companies and Enterprises 10%
Other Services (except Public Administration) 10%
Wholesale Trade 10%
Health Care and Social Assistance 9%
Information 9%
Professional, Scientific, and Technical Services 9%
North Carolina Average (all industries) 9%
Finance and Insurance 8%
Retail Trade 8%
Construction 7%
Admin and Support and Waste Management and Remediation Services 7%
Arts, Entertainment, and Recreation 7%
Accommodation and Food Services 3%
Source: FRB/NSC analysis of 2016-2020 American Community Survey data accessed via IPUMS-USA, University of Minnesota, www.ipums.org
11 The New Landscape of Digital Literacy (National Skills Coalition, 2020.)
12 The Census Bureau’s ACS data does not tell us whether someone resides in a rural or an urban area. However, it does provide infor-
mation on whether someone is located in a metropolitan area, not in a metro area, or if their approximate location is “on the fence”
(i.e., mixed).
30 CLOSING THE DIGITAL SKILL DIVIDE: THE PAYOFF FOR WORKERS, BUSINESS, AND THE ECONOMY CLOSING THE DIGITAL SKILL DIVIDE: THE PAYOFF FOR WORKERS, BUSINESS, AND THE ECONOMY 31

Veterans
Veterans are a critical group for states to consider when developing their Digital Equity Plans. Some veterans
have acquired technology skills through their former military jobs, while others need opportunities to upskill
or reskill into civilian industries that require such skills.
There are roughly 300,000 veterans
13
aged sixteen to sixty-four living in North Carolina. Overall, military veter-
ans comprise 5 percent of working-age North Carolinians. However, some industries have substantially greater
concentrations. For example, roughly 18 percent of public administration workers are veterans, dramatically
higher than any other industry. The transportation and warehousing and the utilities sectors also have a dispro-
portionately high percentage of veterans, at 11 percent and 10 percent of their workforce, respectively.
13 For this analysis, veterans were included only if they are currently in or have worked in industries outside of the military after their
service was completed.
18%
11%
10%
8%
8%
7%
7%
6%
6%
6%
5%
5%
4%
4%
4%
4%
4%
4%
3%
3%
2%
Public Administration
Transportation and Warehousing
Utilities
Mining, Quarrying, and Oil and Gas Extraction
Information
Wholesale Trade
Manufacturing
Admin and Support and Waste Management
Construction
Professional, Scientific, and Technical Services
North Carolina Average (all industries)
Real Estate and Rental and Leasing
Retail Trade
Management of Companies and Enterprises
Agriculture, Forestry, Fishing and Hunting
Other Services (except Public Administration)
Finance and Insurance
Health Care and Social Assistance
Arts, Entertainment, and Recreation
Educational Services
Accommodation and Food Services
FIGURE 5: Percent of veterans among all North Carolina workers 16-64, by Industry of Employment
Source: FRB/NSC analysis of 2016-2020 American Community Survey data accessed via IPUMS-USA, University of Minnesota, www.ipums.org
30 CLOSING THE DIGITAL SKILL DIVIDE: THE PAYOFF FOR WORKERS, BUSINESS, AND THE ECONOMY CLOSING THE DIGITAL SKILL DIVIDE: THE PAYOFF FOR WORKERS, BUSINESS, AND THE ECONOMY 31

Individuals with disabilities
While often thought of as a group that lacks digital skills, individuals living with one or more disabilities are
often on the cutting edge of technology adoption through necessity. For example, people with visual disabili-
ties have long been accustomed to using screen readers, voice-to-text software, and other devices to enable
them to participate equitably in the online world. People with disabilities have also been leaders in developing
new technologies that are widely used by people of all backgrounds, such as automatic captioning for online
videos.
14
However, workers with disabilities also face barriers in seeking and maintaining employment. States seeking
to close equity gaps among this population should work directly with disability advocates to better under-
stand the unique capabilities and particular challenges facing these workers.
The Census Bureau American Community Survey collects disability data across five categories, including
individuals who face:
■
Cognitive difficulty: An individual who has difficulty remembering, concentrating, or making decisions
because of a physical, mental, or emotional problem.
■
Ambulatory difficulty: An individual who has serious difficulty walking or climbing stairs.
■
Independent living difficulty: An individual who has difficulty doing errands alone such as visiting a
doctor’s office or shopping because of a physical, mental, or emotional problem.
■
Self-care difficulty: An individual having difficulty bathing or dressing.
■
Vision or hearing difficulty: An individual who has a condition such as blindness, deafness, or a severe
vision or hearing impairment.
Overall, 7 percent of working-age North Carolina residents have a disability. As shown in Figure 6, the admin
and support and waste management and remediation services industry, the mining, quarrying, and oil and
gas extraction industry, and retail trade industry have a higher-than-average percentage of workers with
disabilities.
14 For example, see: https://www.npr.org/templates/story/story.php?storyId=124501330 and https://news.microsoft.com/features/
people-disabilities-using-improving-accessible-technology/
32 CLOSING THE DIGITAL SKILL DIVIDE: THE PAYOFF FOR WORKERS, BUSINESS, AND THE ECONOMY CLOSING THE DIGITAL SKILL DIVIDE: THE PAYOFF FOR WORKERS, BUSINESS, AND THE ECONOMY 33

FIGURE 6: Percent of North Carolinians aged 16-64 living with a disability, by Industry of Employment
Industry Percent with a disability
Mining, Quarrying, and Oil and Gas Extraction 10%
Admin and Support and Waste Management and Remediation Services 10%
Retail Trade 9%
Transportation and Warehousing 8%
Other Services (except Public Administration) 8%
Construction 8%
Accommodation and Food Services 8%
Public Administration 8%
Agriculture, Forestry, Fishing and Hunting 8%
Manufacturing 7%
North Carolina Average (all industries) 7%
Health Care and Social Assistance 7%
Real Estate and Rental and Leasing 7%
Information 6%
Wholesale Trade 6%
Management of Companies and Enterprises 6%
Utilities 6%
Arts, Entertainment, and Recreation 6%
Educational Services 6%
Professional, Scientific, and Technical Services 5%
Finance and Insurance 4%
Source: FRB/NSC analysis of 2016-2020 American Community Survey data accessed via IPUMS-USA, University of Minnesota, www.ipums.org
32 CLOSING THE DIGITAL SKILL DIVIDE: THE PAYOFF FOR WORKERS, BUSINESS, AND THE ECONOMY CLOSING THE DIGITAL SKILL DIVIDE: THE PAYOFF FOR WORKERS, BUSINESS, AND THE ECONOMY 33
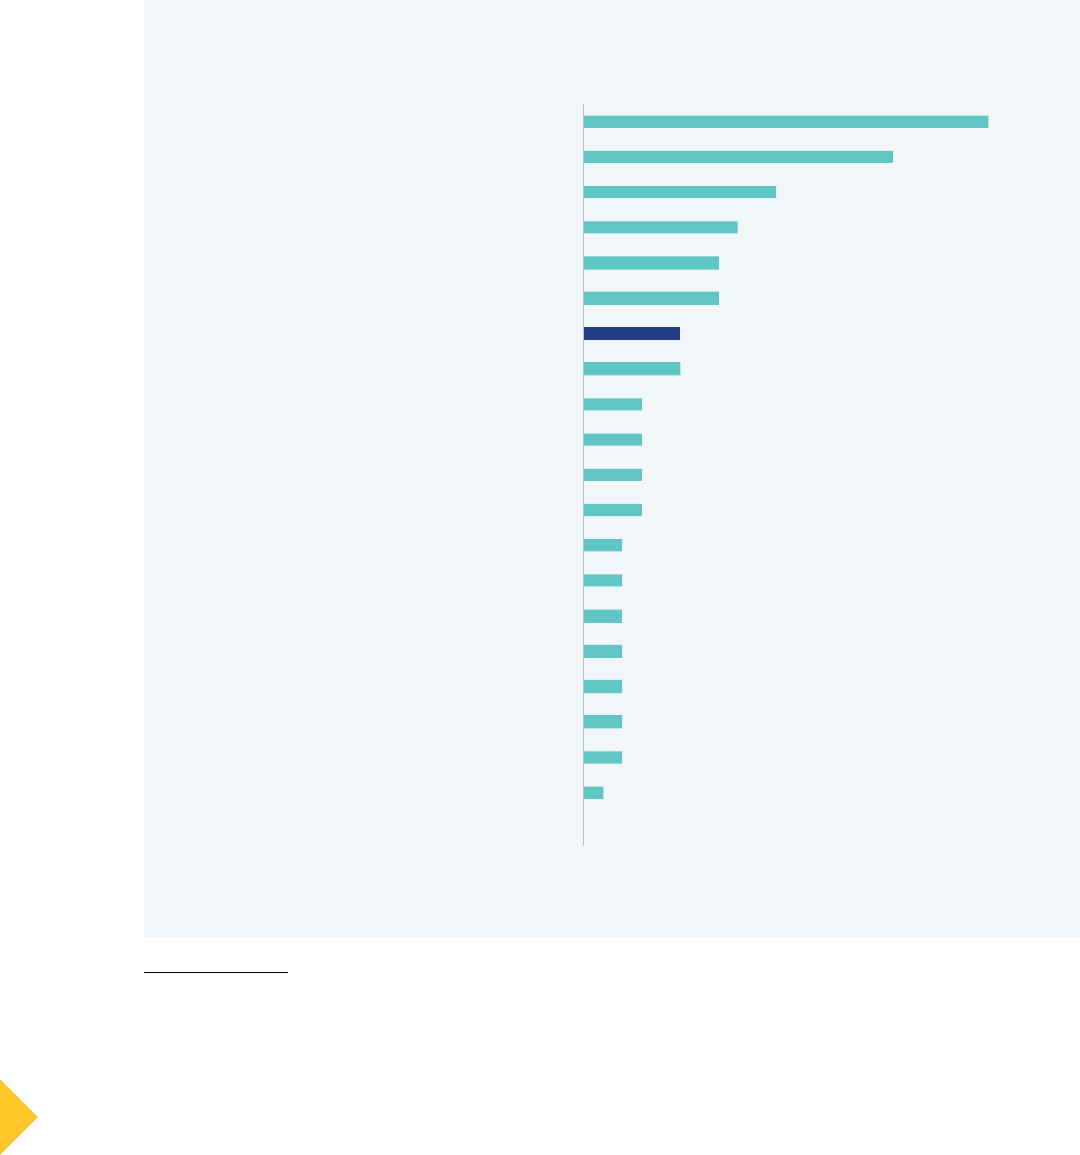
Individuals with English language barriers
While some immigrants and adult English learners have robust digital skills, others need opportunities to
develop those skills. Overall, at the national level, immigrants and adult English learners are more likely to
lack digital skills, compared to white native-born Americans.
15
As states seek to identify effective tools to help
their constituents navigate and acquire digital skills, English language learning models that include strong
digital literacy components will be an important part of the solution.
16
In North Carolina, the agriculture, forestry, fishing, and hunting; construction; and admin and support and
waste management industries have a disproportionate number of workers who have english language
barriers.
15 For more information on this topic, see NSC’s fact sheet on Applying a Racial Equity Lens to Digital Literacy: https://nationalskillsco-
alition.org/wp-content/uploads/2020/12/Digital-Skills-Racial-Equity-Final.pdf.
16 For more information on this topic, see NSC’s Amplifying Impact report: https://nationalskillscoalition.org/wp-content/
uploads/2020/12/06-25-2020-NSC-Amplifying-Impact.pdf
21%
16%
10%
8%
7%
7%
5%
5%
3%
3%
3%
3%
2%
2%
2%
2%
2%
2%
2%
1%
0%
Agriculture, Forestry, Fishing and Hunting
Construction
Admin and Support and Waste Management
Manufacturing
Accommodation and Food Services
Other Services (except Public Administration)
North Carolina Average (all industries)
Wholesale Trade
Transportation and Warehousing
Retail Trade
Utilities
Real Estate and Rental and Leasing
Information
Mining, Quarrying, and Oil and Gas Extraction
Professional, Scientific, and Technical Services
Educational Services
Finance and Insurance
Arts, Entertainment, and Recreation
Health Care and Social Assistance
Public Administration
Management of Companies and Enterprises
FIGURE 7: Percent of North Carolinians aged 16-64 with English language barriers, by Industry of
Employment
Source: FRB/NSC analysis of 2016-2020 American Community Survey data accessed via IPUMS-USA, University of Minnesota, www.ipums.org
34 CLOSING THE DIGITAL SKILL DIVIDE: THE PAYOFF FOR WORKERS, BUSINESS, AND THE ECONOMY CLOSING THE DIGITAL SKILL DIVIDE: THE PAYOFF FOR WORKERS, BUSINESS, AND THE ECONOMY 35

Individuals with limited literacy skills
Across North Carolina, thousands of workers with limited literacy skills are holding down jobs across many
different industries. Employed in retail shops and restaurants, hotels and hospitals, and manufacturing jobs,
among many others, these workers not only help fuel the country’s economy — they keep daily life in America
humming smoothly along.
Due in large measure to structural forces in American society, digital skill needs are closely correlated to
limited literacy skills.
17
As states identify tools to help these constituents and mitigate digital equity needs, it’s
important that they understand the particular challenges facing these workers.
In the full Closing the Digital Skill Divide report, our findings point to the need to invest in workers with limited
formal education. Policymakers should be clear that these workers, who are often employed in entry-level jobs,
need the same access to digital skill-building opportunities that their more educated peers expect and receive.
While the ACS does not specifically gather data on literacy skills, it does include educational attainment data,
so we’ve used educational attainment of lower than high school as a proxy. In North Carolina, the construc-
tion; agriculture, forestry, fishing and hunting; and accommodation and food services industries have a dispro-
portionate number of workers with limited literacy skills.
FIGURE 8: Percent of North Carolinians aged 16-64 with limited literacy skills, by industry of
employment
Industry
Percent with literacy barriers
Agriculture, Forestry, Fishing and Hunting
29%
Construction
25%
Accommodation and Food Services
23%
Admin and Support and Waste Management and Remediation Services
17%
Mining, Quarrying, and Oil and Gas Extraction
15%
Arts, Entertainment, and Recreation
14%
Manufacturing
12%
Other Services (except Public Administration)
11%
Retail Trade
10%
North Carolina Average (all industries)
10%
Wholesale Trade
9%
Transportation and Warehousing
9%
Real Estate and Rental and Leasing
5%
Utilities
3%
Health Care and Social Assistance
3%
Information
3%
Management of Companies and Enterprises
2%
Educational Services
2%
Public Administration
2%
Professional, Scientific, and Technical Services
2%
Finance and Insurance
1%
Source: FRB/NSC analysis of 2016-2020 American Community Survey data accessed via IPUMS-USA, University of Minnesota, www.ipums.org
17 The New Landscape of Digital Literacy (National Skills Coalition, 2020) and Foundational Skills in the Service Sector (National Skills
Coalition, 2018).
34 CLOSING THE DIGITAL SKILL DIVIDE: THE PAYOFF FOR WORKERS, BUSINESS, AND THE ECONOMY CLOSING THE DIGITAL SKILL DIVIDE: THE PAYOFF FOR WORKERS, BUSINESS, AND THE ECONOMY 35

People of color
While many workers facing a digital skill divide are white, people of color are disproportionately affected.
18
The ripple effects of historical policies and structural racism continue to contribute to modern-day inequities
in digital skills and access to them. From digital redlining that limits the availability of high-speed internet in
some communities, to under-funded educational institutions unable to provide their students with robust
digital technologies for learning, barriers to access often limit workers’ ability to build digital skills and busi-
nesses’ ability to advance into the digital age. These wide-ranging effects emphasize the vital role of public
policy in remedying inequities caused by prior policies.
As states identify ways to target their Digital Equity Act investments to reduce racial inequities, understand-
ing the industries with high concentrations of workers of color can point the way.
In North Carolina, Black workers (who represent 21% of working-age state residents overall) are dispropor-
tionately concentrated in the transportation and warehousing (34%), admin and support and waste manage-
ment and remediation services (27%), and manufacturing (23%) industries.
Workers of Hispanic or Latino origin (who represent 9% of working-age state residents) are disproportion-
ately concentrated in the agriculture, forestry, fishing and hunting (27%), construction (25%), and accommo-
dation and food services (14%) industries.
Asian American and Pacific Islander workers (who represent 3% of working-age state residents) are dispro-
portionately concentrated in the professional, scientific, and technical services (8%), management of compa-
nies and enterprises (6%), and the other services except public administration (6%) industries.
American Indian or Alaska Native people (who represent 0.9% of working-age state residents) are dispropor-
tionately concentrated in the public administration (1.5%), agriculture, forestry, fishing and hunting (1.2%),
and construction (1.1%) industries.
When looking at the intersection of race and gender, Black women in North Carolina (who represent 12% of
working-age residents) are more likely to be in health care and social assistance (23% of health care work-
ers); Black men (10% of working-age state residents) in manufacturing (14%); Latinas (4% of working-age
state residents) in agriculture, forestry, fishing and hunting (8%); and Latinos (5% of working-age state
residents) in construction (23%).
Asian women (2% of working-age state residents) are over-represented in the other services except public
administration (4%) industry sector; asian men (2% of working-age state residents) are more concentrated
in professional, scientific, and technical services (5%); American Indian or Alaska Native women (0.5% of
working-age state residents) in health care and social assistance (0.9%); and American Indian or Alaska
Native men (0.5% of working-age state residents) in construction (1.5%) sectors.
Notably, many of these industries are also ones that employ significant numbers of other “covered popula-
tions”, making them particularly appealing areas for state policymakers to target.
Closing equity gaps can catapult both workers and businesses to greater economic success. As the data on
occupational segregation highlights, many marginalized workers are clustered in industries that have rap-
idly growing demand for technological skills. As a result, both workers themselves and the companies that
employ them can flourish if given the opportunity for upskilling.
Individuals living in rural areas
Individuals in rural communities face compounded challenges — they are more likely to lack broadband inter-
net access due to their geographic location, and this lack of access then hampers their ability to get online
and build better digital skills by participating in educational and workforce opportunities. Tackling these
issues is crucial to ensure an even playing field for individuals in rural areas.
18 For more information on this topic, see NSC’s fact sheet on Applying a Racial Equity Lens to Digital Literacy: https://nationalskillsco-
alition.org/wp-content/uploads/2020/12/Digital-Skills-Racial-Equity-Final.pdf.
36 CLOSING THE DIGITAL SKILL DIVIDE: THE PAYOFF FOR WORKERS, BUSINESS, AND THE ECONOMY CLOSING THE DIGITAL SKILL DIVIDE: THE PAYOFF FOR WORKERS, BUSINESS, AND THE ECONOMY 37

The Census Bureau American Community Survey does not tell us whether someone resides in a rural or an
urban area. However, it does provide information on whether someone is located in a metropolitan area, not
in a metro area, or if their approximate location is “on the fence” (i.e., mixed). In North Carolina, 75 percent of
American Indians or Alaska Natives live in non-metro or mixed areas, significantly above the 28 percent aver-
age for North Carolina and the 19 percent average for the United States. In the industries that American Indian
and Alaska Native women and men are disproportionately in, public administration and construction, roughly
78 percent of the American Indians and Alaska Natives in those jobs reside in non-metro or mixed areas.
In North Carolina, the agriculture, forestry, fishing and hunting; construction; and mining, quarrying, and oil and
gas extraction industries have disproportionate percentages of workers located in non-metro or mixed areas.
57%
53%
35%
33%
33%
29%
29%
29%
28%
28%
27%
27%
26%
25%
25%
23%
23%
19%
18%
16%
15%
Agriculture, Forestry, Fishing and Hunting
Mining, Quarrying, and Oil and Gas Extraction
Public Administration
Construction
Manufacturing
Utilities
Health Care and Social Assistance
Retail Trade
Other Services (except Public Administration)
North Carolina Average (all industries)
Accommodation and Food Services
Educational Services
Admin and Support and Waste Management and…
Transportation and Warehousing
Arts, Entertainment, and Recreation
Wholesale Trade
Real Estate and Rental and Leasing
Information
Management of Companies and Enterprises
Finance and Insurance
Professional, Scientific, and Technical Services
FIGURE 9: Percent of North Carolinians aged 16-64 that reside in non-metro or mixed areas,
by industry of employment
Source: FRB/NSC analysis of 2016-2020 American Community Survey data accessed via IPUMS-USA, University of Minnesota, www.ipums.org
36 CLOSING THE DIGITAL SKILL DIVIDE: THE PAYOFF FOR WORKERS, BUSINESS, AND THE ECONOMY CLOSING THE DIGITAL SKILL DIVIDE: THE PAYOFF FOR WORKERS, BUSINESS, AND THE ECONOMY 37

Individuals who are currently incarcerated
People who are incarcerated (in non-federal institutions) are another “covered population” under the
Digital Equity Act. These individuals face particular challenges in building digital skills while behind bars.
Correctional education programs may restrict or even prohibit the use of digital technology or internet
access, which puts justice-involved people at a disadvantage when reentering society.
The Sentencing Project, a nonprofit organization, found that in North Carolina, there are almost 50,000 peo-
ple incarcerated in prisons or jails.
19
The Sentencing Project also found that the Black imprisonment rate in
North Carolina is almost four times the white imprisonment rate. Removing technology and internet restric-
tions can allow individuals to prepare effectively for life and employment after release.
20
ILLINOIS
THE BIG PICTURE: UNDERSTANDING THE DEMAND FOR DIGITAL SKILLS
Illinois is the largest midwestern state by population and economic activity. There are about 12.7 million
people in Illinois, and its GDP
21
was about $950 billion in 2021. The median household income
22
in the state is
about $68,500. The race and ethnicity of Illinois residents closely align with the national population; roughly
62 percent of working age people are white, 13 percent are Black, 17 percent are Latinx, 6 percent are Asian
American or Pacific Islander, and less than 1 percent are American Indian or Alaska Native.
Illinois has strong demand for workers with technology skills. In the Lightcast dataset of 2021 job postings
used for this analysis,
23
there were more than 1.7 million postings for jobs located in the state. Among those
job ads, 812,000 or 47 percent, required at least one definitely digital skill, and 90 percent required a
definitely or likely digital skill. Per this data, employers in Illinois are close to the national averages in their
need for technologically skilled workers.
ZOOMING IN: DIGITAL SKILL DEMANDS DIFFER BY INDUSTRY
Foundational skills such as spreadsheets, data entry, word processing, and basic “computer literacy” are
widely required across all industries in Illinois. But when it comes to more sophisticated skills, there are nota-
ble differences by sectors. For example, many Illinois job postings in the manufacturing industry require famil-
iarity with Enterprise Resource Planning (ERP) software, while in the retail sector there is strong demand for
e-commerce, point of sale systems, and robotics expertise. In finance and insurance, many employers are
looking for workers with Nationwide Mortgage Licensing System (NMLS) software skills, while in accommo-
dation and food services, familiarity with Delphi software is in regular demand. In the health care and social
assistance sector, experience with electronic health records is crucial.
19 U.S. Criminal Justice Data, The Sentencing Project (2022)
20 Building the Technology Ecosystem for Correctional Education: Brief and Discussion Guide https://lincs.ed.gov/sites/default/files/
tech-ecosystem-correctional-ed.pdf, (U.S. Department of Education, 2022.)
21 Gross Domestic Product: All Industry Total in Illinois, U.S. Bureau of Economic Analysis, retrieved from FRED, Federal Reserve Bank
of St. Louis (2022)
22 QuickFacts: Illinois, U.S. Census Bureau (2022)
23 For more information on this dataset, see the full report: Closing the Digital Skill Divide: The Payoff for Workers, Business, and the
Economy.
38 CLOSING THE DIGITAL SKILL DIVIDE: THE PAYOFF FOR WORKERS, BUSINESS, AND THE ECONOMY CLOSING THE DIGITAL SKILL DIVIDE: THE PAYOFF FOR WORKERS, BUSINESS, AND THE ECONOMY 39

Knowing which digital skills are broadly in demand throughout an industry sector — or are transferrable
across different industries — can help stakeholders to make wise decisions about where to invest time and
resources. State policymakers and workforce and education advocates can stress-test workforce program
designs against on-the-ground data from employers and job postings to ensure a clear connection between
training programs’ focus and the skills workers will need on the job.
The Lightcast dataset also reveals some occupations where demand in Illinois is especially acute. The
roles highlighted in Figure 10 do not require a bachelor’s degree, and therefore could be valuable oppor-
tunities for workers with more limited education who are seeking to build their digital skills and obtain
higher-wage employment.
Consistent with national findings, these in-demand Illinois jobs typically require both foundational and indus-
try-specific digital skills. For example, both Microsoft Excel (a foundational skill) and the more specialized
accounting software QuickBooks are frequently listed in job ads for bookkeeper/accounting clerk positions.
In job postings for office or administrative assistants, basic “typing” is a highly requested skill. But these job ads
also call for a range of more sophisticated skills, from SAP to Enterprise Resource Planning (ERP) to Salesforce.
FIGURE 10: Top Sub-Baccalaureate occupations in Illinois with high demand for digital skills (2021)
Occupation
Total job
postings in
Illinois (2021)
Subset of
job postings
requesting
definitely
digital skills
Percent of
job postings
requiring
definitely
digital skills
Data Entry Clerk 1,352 1,343 99%
Software Developer / Engineer 1,392 1,317 95%
Computer Support Specialist 2,945 2,781 94%
Bookkeeper / Accounting Clerk 4,962 4, 474 90%
Office / Administrative Assistant 12,813 10,889 85%
Human Resources / Labor Relations Specialist 1,553 1,295 83%
Scheduler / Operations Coordinator 2,529 2,051 81%
Recruiter 1,989 1,584 80%
Insurance Sales Agent 1,668 1,291 77%
Radiologic Technician / Technologist 1,487 1,137 76%
Source: FRB/NSC analysis of Lightcast data.
Note: Occupations that had fewer than 1,000 total job posts in the 2021 Lightcast dataset were omitted.
38 CLOSING THE DIGITAL SKILL DIVIDE: THE PAYOFF FOR WORKERS, BUSINESS, AND THE ECONOMY CLOSING THE DIGITAL SKILL DIVIDE: THE PAYOFF FOR WORKERS, BUSINESS, AND THE ECONOMY 39

Digital skills in real life: What skills look like on the job
Knowing how digital skills are showing up in the real world can help state leaders and other stakeholders to
connect the dots between workforce and education investments, talent development pipelines, and business
vitality. Below, selected major Illinois industry sectors are highlighted with examples.
Manufacturing
Nearly 800,000 Illinoisans work in the manufacturing sector. Manufacturing workers in Illinois are
disproportionately likely to be Latino compared to the overall workforce in the state. Manufacturing
workers are also more likely to have limited educational attainment — a high school diploma (or less) —
more likely to live in rural areas, and more likely to have limited proficiency in English.
24
While roles such as CNC operator or Programmable Logic Control (PLC) technician have long required
some degree of digital skills, the transformation to Industry 4.0 is driving increased digital adop-
tion in companies large and small. Manufacturing companies today are increasingly seeking workers
with expertise in areas as diverse as robotics, AutoCAD, Human-Machine Interface, Computer-Aided
Manufacturing (CAM), and customer relationship management (CRM) software.
One recent survey from a neighboring Midwestern state showed that the percentage of advanced
manufacturing companies adopting Industry 4.0 technologies doubled between 2020 and 2021,
25
a rapid
rate of increase that coincided with the beginning of the Covid pandemic. In particular, the number of
companies using 3D printing technology grew from 24 percent to 39 percent, and the number using
collaborative robots grew from 6 percent to 22 percent.
Retail
Retail is a major industry in Illinois, employing more than 750,000 people. Retail workers in the state
are disproportionately likely to be Latino or Black, compared to the overall workforce in Illinois. Retail
workers are also more likely to have limited educational attainment (that is, education short of a bache-
lor’s degree), and to be younger than the average worker.
26
Technology demands in this sector have been steadily growing over the past two decades. One recent
analysis found that the retail industry saw a sizeable jump from 2002 to 2016 in the amount of digital
skills and knowledge demanded of its workforce.
27
Roles within the retail industry require a wide variety
of digital skills. Examples include inventory clerks using customized smartphone apps to categorize and
process returned items; cosmetic company employees completing online learning modules to boost their
digital marketing expertise; and auto technicians using computerized diagnostic tools to tackle repair jobs.
Large retailers have led the way with an exceptionally rapid pace of technological change. For example,
global cosmetics giant L’Oreal has provided digital upskilling opportunities for 14,000 employees,
28
while
Walmart has rolled out a suite of digital apps that frontline workers are expected to use for activities
such as price changes, processing inventory, and more.
29
In Illinois, retailers frequently seek workers with foundational skills such as the Microsoft Office suite,
as well as more specialized skills in e-commerce and virtual sales, Customer Relationship Management
(CRM) applications such as Salesforce, and SAS retail analytics software.
24 FRB/NSC analysis of 2016-2020 American Community Survey data accessed via IPUMS-USA, University of Minnesota, www.ipums.org.
25 See: https://www.conexusindiana.com/2022/01/new-study-tech-adoption-among-indiana-advanced-manufacturers-more-than-
doubles-from-2020-to-2021/
26 FRB/NSC analysis of 2016-2020 American Community Survey data accessed via IPUMS-USA, University of Minnesota, www.ipums.org.
27 https://www.brookings.edu/wp-content/uploads/2017/11/mpp_2017nov15_digitalization_full_report.pdf
28 Learn more: https://www.loreal-finance.com/en/annual-report-2016/digital-culture
29 Learn more: https://corporate.walmart.com/newsroom/innovation/20180919/
walmarts-custom-apps-are-enabling-a-workplace-refresh
40 CLOSING THE DIGITAL SKILL DIVIDE: THE PAYOFF FOR WORKERS, BUSINESS, AND THE ECONOMY CLOSING THE DIGITAL SKILL DIVIDE: THE PAYOFF FOR WORKERS, BUSINESS, AND THE ECONOMY 41

Healthcare
More than 900,000 workers in Illinois are employed in the healthcare sector. Compared to the overall
Illinois workforce, healthcare workers are disproportionately likely to be Black or Asian American and
Pacific Islander, and they are also more likely to be women and to have college degrees.
30
While electronic medical records have been common in the healthcare field for more than a decade, the
pandemic greatly accelerated other aspects of digital transformation across the industry. Interviews
conducted by NSC have documented some common digital skill demands on the job. For example, com-
munity health workers and personal care aides often use smartphones or tablet computers to capture
patient information or record their own working hours for payroll purposes. These easy-to-carry tools
are especially important for healthcare workers who work in the field and do not have the desk space or
permanent setup for larger computer equipment that their peers working in hospitals or nursing homes
may have.
In clinics and medical offices, reception-desk workers are increasingly responsible for assisting patients
in installing, using, and troubleshooting telehealth services. And even healthcare sector workers in
non-clinical jobs have had to adapt to more digitally driven processes in procurement and compliance.
PUTTING THIS DATA TO WORK:
RESOURCES FOR STATE DIGITAL EQUITY PLANNING
As noted above, states are now engaged in their federally required development of 5-year Digital Equity Act
plans and 5-year Broadband Equity, Access, and Deployment (BEAD) Action Plans.
State Digital Equity Plans must describe how states will close the digital skill divide for the following
populations:
■
Low-income individuals;
■
Aging individuals;
■
Veterans;
■
Individuals with disabilities;
■
Individuals with English language barriers;
■
Individuals with limited literacy skills;
■
People of color;
■
Individuals living in rural areas; and
■
Individuals currently incarcerated (in non-federal correctional facilities).
In this section, we highlight data sources that states can use to better understand each population. By
juxtaposing this Census Bureau American Community Survey with our Lightcast findings, states can better
identify where to focus their digital skill-building investments.
Low-income individuals
As described in the full Closing the Digital Skill Divide report, low income individuals face significant chal-
lenges in building their digital skills and are disproportionately likely
to lack such skills.
Twelve percent of Illinoisans live in households that are at or below 150 percent of the poverty line. That
figure is even higher for the subset of individuals working
31
in certain industries. For example, it rises to 22
percent for workers in the accommodation and food services sector, 21 percent for workers in the
30 FRB/NSC analysis of 2016-2020 American Community Survey data accessed via IPUMS-USA, University of Minnesota, www.ipums.org.
31 For individuals who are not currently working, the data reflect the industry in which they were most recently employed.
40 CLOSING THE DIGITAL SKILL DIVIDE: THE PAYOFF FOR WORKERS, BUSINESS, AND THE ECONOMY CLOSING THE DIGITAL SKILL DIVIDE: THE PAYOFF FOR WORKERS, BUSINESS, AND THE ECONOMY 41

22%
21%
16%
16%
14%
13%
13%
12%
12%
12%
10%
10%
9%
8%
8%
8%
6%
6%
5%
5%
5%
Accommodation and Food Services
Admin and Support and Waste Management and…
Other Services (except Public Administration)
Retail Trade
Agriculture, Forestry, Fishing and Hunting
Construction
Arts, Entertainment, and Recreation
Transportation and Warehousing
Health Care and Social Assistance
Illinois Average (all industries)
Manufacturing
Real Estate and Rental and Leasing
Mining, Quarrying, and Oil and Gas Extraction
Educational Services
Wholesale Trade
Information
Public Administration
Professional, Scientific, and Technical Services
Public Administration
Utilities
Finance and Insurance
FIGURE 11: Percent of Illinoisans aged 16-64 living in low income households, by Industry of
Employment
Source: FRB/NSC analysis of 2016-2020 American Community Survey data accessed via IPUMS-USA, University of Minnesota, www.ipums.org
administrative and support and waste management and remediation services, and 13 percent for individuals
in the construction sector.
This data is particularly notable because there is strong demand for workers with digital skills in these
industries: Nationwide, 23 percent of accommodation and food services, 49 percent of administrative
and support and waste management, and 39 percent of construction job postings required at least one
definitely digital skill.
This demand data helps illustrate that Illinois has multiple reasons to invest in these workers: To support
their individual economic mobility; to meet federal Digital Equity Act requirements for reducing inequities;
and finally, to ensure that Illinois businesses in key industries have access to a competitive talent pool that is
equipped with necessary technological skills.
42 CLOSING THE DIGITAL SKILL DIVIDE: THE PAYOFF FOR WORKERS, BUSINESS, AND THE ECONOMY CLOSING THE DIGITAL SKILL DIVIDE: THE PAYOFF FOR WORKERS, BUSINESS, AND THE ECONOMY 43

Aging individuals
In general, aging populations have slightly lower levels of digital skills than younger populations,
32
so they
should also be considered when developing community-centric programs. Focusing on digital skills solely
during K-12 education is insufficient. Adult workers need timely, relevant education and workforce devel-
opment opportunities at mid career and even later in their working years, as their jobs continue to change
beneath their feet.
In Illinois, 9 percent of working age individuals are aged between sixty and sixty-four. The agriculture, forestry,
fishing and hunting sector and the utilities industry have disproportionate numbers of older workers.
FIGURE 12: Percent of Illinoisans aged 60-64, by Industry of Employment
Industry % Working age adults 60 or above
Agriculture, Forestry, Fishing and Hunting 14%
Utilities 12%
Real Estate and Rental and Leasing 12%
Public Administration 11%
Manufacturing 10%
Mining, Quarrying, and Oil and Gas Extraction 10%
Wholesale Trade 10%
Health Care and Social Assistance 10%
Other Services (except Public Administration) 10%
Educational Services 9%
Transportation and Warehousing 9%
Information 9%
Construction 9%
Management of Companies and Enterprises 9%
Illinois Average (all industries) 9%
Finance and Insurance 9%
Admin and Support and Waste Management and Remediation Services 8%
Professional, Scientific, and Technical Services 8%
Retail Trade 7%
Arts, Entertainment, and Recreation 6%
Accommodation and Food Services 3%
Source: FRB/NSC analysis of 2016-2020 American Community Survey data accessed via IPUMS-USA, University of Minnesota, www.ipums.org
32 The New Landscape of Digital Literacy (National Skills Coalition, 2020.)
42 CLOSING THE DIGITAL SKILL DIVIDE: THE PAYOFF FOR WORKERS, BUSINESS, AND THE ECONOMY CLOSING THE DIGITAL SKILL DIVIDE: THE PAYOFF FOR WORKERS, BUSINESS, AND THE ECONOMY 43

Veterans
Veterans are a critical group for states to consider when developing their Digital Equity Plans. Some veterans
have acquired technology skills through their former military jobs, while others need opportunities to upskill
or reskill into civilian occupations that require such skills.
There are roughly 220,000 veterans
33
aged 16-64 living in Illinois. Overall, military veterans comprise 3
percent of working age Illinoisans. However, some industries have substantially greater concentrations.
For example, roughly 11 percent of public administration workers are veterans. The utilities and the mining,
quarrying, and oil and gas extraction sectors also have a disproportionately high percentage of veterans,
at 9 percent and 8 percent of their workforce, respectively.
33 For this analysis, veterans were only included if they are currently in or have worked in industries outside of the military after their
service was completed.
11%
9%
8%
6%
5%
4%
4%
3%
3%
3%
3%
3%
3%
2%
2%
2%
2%
2%
2%
1%
1%
Public Administration
Utilities
Mining, Quarrying, and Oil and Gas Extraction
Transportation and Warehousing
Construction
Manufacturing
Wholesale Trade
Admin and Support and Waste Management and…
Illinois Average (all industries)
Information
Real Estate and Rental and Leasing
Professional, Scientific, and Technical Services
Agriculture, Forestry, Fishing and Hunting
Other Services (except Public Administration)
Retail Trade
Health Care and Social Assistance
Arts, Entertainment, and Recreation
Finance and Insurance
Educational Services
Management of Companies and Enterprises
Accommodation and Food Services
FIGURE 13: Percent of veterans among all Illinois workers 16-64, by Industry of Employment
Source: FRB/NSC analysis of 2016-2020 American Community Survey data accessed via IPUMS-USA, University of Minnesota, www.ipums.org
44 CLOSING THE DIGITAL SKILL DIVIDE: THE PAYOFF FOR WORKERS, BUSINESS, AND THE ECONOMY CLOSING THE DIGITAL SKILL DIVIDE: THE PAYOFF FOR WORKERS, BUSINESS, AND THE ECONOMY 45

Individuals living with disabilities
While often thought of as a group that lacks digital skills, individuals living with one or more disabilities
are often on the cutting edge of technology adoption through necessity. For example, people with visual
disabilities have long been accustomed to using screen readers, voice-to-text software, and other devices
to enable them to participate equitably in the online world. People with disabilities have also been leaders
in developing new technologies that are widely used by people of all backgrounds, such as automatic
captioning for online videos.
34
However, workers with disabilities also face significant barriers in seeking and maintaining employment.
States seeking to close equity gaps among this population should work directly with disability advocates to
better understand the unique capabilities and particular challenges facing these workers.
The Census Bureau American Community Survey collects disability data across five categories of individuals,
including those who face:
■
Cognitive difficulty: An individual that has difficulty remembering, concentrating, or making decisions
because of a physical, mental, or emotional problem.
■
Ambulatory difficulty: An individual that has serious difficulty walking or climbing stairs.
■
Independent living difficulty: An individual that has difficulty doing errands alone such as visiting a
doctor’s office or shopping because of a physical, mental, or emotional problem.
■
Self-care difficulty: An individual having difficulty bathing or dressing.
■
Vision or hearing difficulty: Conditions that include blindness, deafness, or a severe vision or hearing
impairment.
Overall, 6 percent of working age Illinois residents have a disability. As shown in Figure 5, the admin and
support and waste management and remediation services industry; the mining, quarrying, and oil and
gas extraction industry; and retail trade industry have a higher-than-average percentage of workers with
disabilities.
34 For example, see: https://www.npr.org/templates/story/story.php?storyId=124501330 and https://news.microsoft.com/features/
people-disabilities-using-improving-accessible-technology/
44 CLOSING THE DIGITAL SKILL DIVIDE: THE PAYOFF FOR WORKERS, BUSINESS, AND THE ECONOMY CLOSING THE DIGITAL SKILL DIVIDE: THE PAYOFF FOR WORKERS, BUSINESS, AND THE ECONOMY 45

FIGURE 14: Percent of Illinoisans aged 16-64 living with a disability, by Industry of Employment
Industry Percent with
a disability
Admin and Support and Waste Management and Remediation Services 8%
Mining, Quarrying, and Oil and Gas Extraction 7%
Public Administration 7%
Retail Trade 7%
Accommodation and Food Services 6%
Health Care and Social Assistance 6%
Manufacturing 6%
Transportation and Warehousing 6%
Agriculture, Forestry, Fishing and Hunting 6%
Utilities 6%
Construction 6%
Other Services (except Public Administration) 6%
Illinois Average (all industries) 6%
Arts, Entertainment, and Recreation 6%
Real Estate and Rental and Leasing 6%
Wholesale Trade 5%
Management of Companies and Enterprises 5%
Information 5%
Educational Services 5%
Professional, Scientific, and Technical Services 4%
Finance and Insurance 3%
Source: FRB/NSC analysis of 2016-2020 American Community Survey data accessed via IPUMS-USA, University of Minnesota, www.ipums.org
46 CLOSING THE DIGITAL SKILL DIVIDE: THE PAYOFF FOR WORKERS, BUSINESS, AND THE ECONOMY CLOSING THE DIGITAL SKILL DIVIDE: THE PAYOFF FOR WORKERS, BUSINESS, AND THE ECONOMY 47

FIGURE 15: Percent of Illinoisans aged 16-64 with English language barriers, by Industry of
Employment
Source: FRB/NSC analysis of 2016-2020 American Community Survey data accessed via IPUMS-USA, University of Minnesota, www.ipums.org
Individuals with English language barriers
While some immigrants and adult English learners have robust digital skills, others need opportunities to
develop those skills. Overall, at the national level, immigrants and adult English learners are more likely to
lack digital skills, compared to white native-born Americans.
35
As states seek to identify effective tools to help
their constituents navigate and acquire digital skills, English language learning models that include strong
digital literacy components will be an important part of the solution.
36
In Illinois, the admin and support and waste management and remediation services; construction; and
accommodation and food services industries have a disproportionate number of workers who have English
language barriers.
35 For more information on this topic, see NSC’s fact sheet on Applying a Racial Equity Lens to Digital Literacy: https://nationalskillsco-
alition.org/wp-content/uploads/2020/12/Digital-Skills-Racial-Equity-Final.pdf.
36 For more information on this topic, see NSC’s Amplifying Impact report: https://nationalskillscoalition.org/wp-content/
uploads/2020/12/06-25-2020-NSC-Amplifying-Impact.pdf
18%
16%
16%
14%
13%
11%
10%
9%
6%
6%
5%
5%
5%
4%
4%
3%
3%
3%
3%
2%
2%
Admin and Support and Waste Management
Manufacturing
Construction
Accommodation and Food Services
Other Services (except Public Administration)
Transportation and Warehousing
Wholesale Trade
Illinois Average (all industries)
Retail Trade
Real Estate and Rental and Leasing
Agriculture, Forestry, Fishing and Hunting
Health Care and Social Assistance
Arts, Entertainment, and Recreation
Educational Services
Professional, Scientific, and Technical Services
Information
Finance and Insurance
Utilities
Management of Companies and Enterprises
Public Administration
Mining, Quarrying, and Oil and Gas Extraction
46 CLOSING THE DIGITAL SKILL DIVIDE: THE PAYOFF FOR WORKERS, BUSINESS, AND THE ECONOMY CLOSING THE DIGITAL SKILL DIVIDE: THE PAYOFF FOR WORKERS, BUSINESS, AND THE ECONOMY 47

Individuals with limited literacy skills
Across Illinois, thousands of workers with limited literacy skills are holding down jobs across many different
industries. Employed in retail shops and restaurants, hotels and hospitals, and manufacturing jobs, among
many others, these workers not only help fuel the country’s economy — they keep daily life in America hum-
ming smoothly along.
Due in large measure to structural forces in American society, digital skill gaps are closely correlated to
limited literacy skills. As states identify tools to help these constituents and mitigate digital equity gaps, it’s
important that they understand the particular challenges facing these workers.
In the full Closing the Digital Skill Divide report, our findings point to the need to invest in workers with limited
formal education. Policymakers should be clear that these workers, who are often employed in entry-level jobs,
need the same access to digital skill-building opportunities that their more-educated peers expect and receive.
While the The Census Bureau American Community Survey does not specifically gather data on literacy
skills, it does include educational attainment data, so we’ve used educational attainment of lower than a high
school diploma as a proxy. In Illinois, the accommodation and food services; arts, entertainment, and recre-
ation; and manufacturing industries are among those with a disproportionate number of workers with this
limited educational attainment (and thus likely limited literacy skills
37
).
FIGURE 16: Percent of Illinoisans aged 16-64 with limited literacy skills, by Industry of Employment
Industry Percent with literacy barriers
Accommodation and Food Services 24%
Admin and Support and Waste Management and Remediation Services 18%
Arts, Entertainment, and Recreation 18%
Construction 16%
Agriculture, Forestry, Fishing and Hunting 14%
Manufacturing 13%
Other Services (except Public Administration) 11%
Retail Trade 10%
Mining, Quarrying, and Oil and Gas Extraction 10%
Illinois Average (all industries) 9%
Wholesale Trade 9%
Transportation and Warehousing 9%
Real Estate and Rental and Leasing 5%
Health Care and Social Assistance 4%
Information 4%
Educational Services 3%
Public Administration 3%
Utilities 2%
Management of Companies and Enterprises 2%
Professional, Scientific, and Technical Services 1%
Finance and Insurance 1%
Source: FRB/NSC analysis of 2016-2020 American Community Survey data accessed via IPUMS-USA, University of Minnesota, www.ipums.org
37 The New Landscape of Digital Literacy (National Skills Coalition, 2020) and Foundational Skills in the Service Sector (National Skills
Coalition, 2018).
48 CLOSING THE DIGITAL SKILL DIVIDE: THE PAYOFF FOR WORKERS, BUSINESS, AND THE ECONOMY CLOSING THE DIGITAL SKILL DIVIDE: THE PAYOFF FOR WORKERS, BUSINESS, AND THE ECONOMY 49

People of color
While many workers facing a digital skill divide are white, people of color are disproportionately affected.
38
The ripple effects of historical policies and structural racism continue to contribute to modern-day inequities
in digital skills and access to them. From digital redlining that limits the availability of high-speed internet in
some communities, to under-funded educational institutions unable to provide their students with robust
digital technologies for learning, barriers to access often limit workers’ ability to build digital skills and busi-
nesses’ ability to advance into the digital age. These wide-ranging effects emphasize the vital role of public
policy in remedying inequities caused by prior policies.
As states identify ways to target their Digital Equity Act investments to reduce racial inequities, understand-
ing which industries have especially high concentrations of workers of color can point the way.
In Illinois, Black workers (who represent 13% of working-age state residents overall) are disproportionately
concentrated in the transportation and warehousing (24%); admin and support and waste management and
remediation services (19%); and public administration (19%) industries.
Workers of Hispanic or Latino origin (who represent 17% of working-age state residents) are dispropor-
tionately concentrated in the admin and support and waste management and remediation services (29%);
accommodation and food services (28%); and manufacturing (24%) industries.
Asian American and Pacific Islander workers (who represent 6% of working-age state residents) are dispro-
portionately concentrated in the professional, scientific, and technical services management of companies
and enterprises (12%); health care and social assistance (9%); and finance and insurance (8%) industries.
American Indian or Alaska Native people (who represent 0.1% of working-age state residents) are dispropor-
tionately concentrated in the mining, quarrying, and oil and gas extraction (0.2%) industry.
When looking at the intersection of race and gender, Black women in Illinois (who represent 7% of work-
ing-age residents) are more likely to be in health care and social assistance (15% of health care workers);
Black men (6% of working-age state residents) in transportation and warehousing (15%); Latinas (8% of
working-age state residents) in accommodation and food services (13%); and Latinos (9% of working-age
state residents) in construction (22%).
Asian women (3% of working-age state residents) are over-represented in the health care and social assis-
tance (6%) industry sector; Asian men (3% of working-age state residents) are more concentrated in
professional, scientific, and technical services (8%); American Indian or Alaska Native women (0.05% of
working-age state residents) in mining, quarrying, and oil and gas extraction (0.16%); and American Indian or
Alaska Native men (0.04% of working-age state residents) in utilities (0.14%) sectors.
Notably, many of these industries also employ significant numbers of other “covered populations”, making
them particularly appealing areas for state policymakers to target.
Closing equity gaps can catapult both workers and businesses to greater economic success. As this data on
occupational segregation highlights, many marginalized workers are clustered in industries that have rap-
idly growing demand for technological skills. As a result, both workers themselves and the companies that
employ them can flourish if given the opportunity for upskilling.
38 For more information on this topic, see NSC’s fact sheet on Applying a Racial Equity Lens to Digital Literacy: https://nationalskillsco-
alition.org/wp-content/uploads/2020/12/Digital-Skills-Racial-Equity-Final.pdf.
48 CLOSING THE DIGITAL SKILL DIVIDE: THE PAYOFF FOR WORKERS, BUSINESS, AND THE ECONOMY CLOSING THE DIGITAL SKILL DIVIDE: THE PAYOFF FOR WORKERS, BUSINESS, AND THE ECONOMY 49
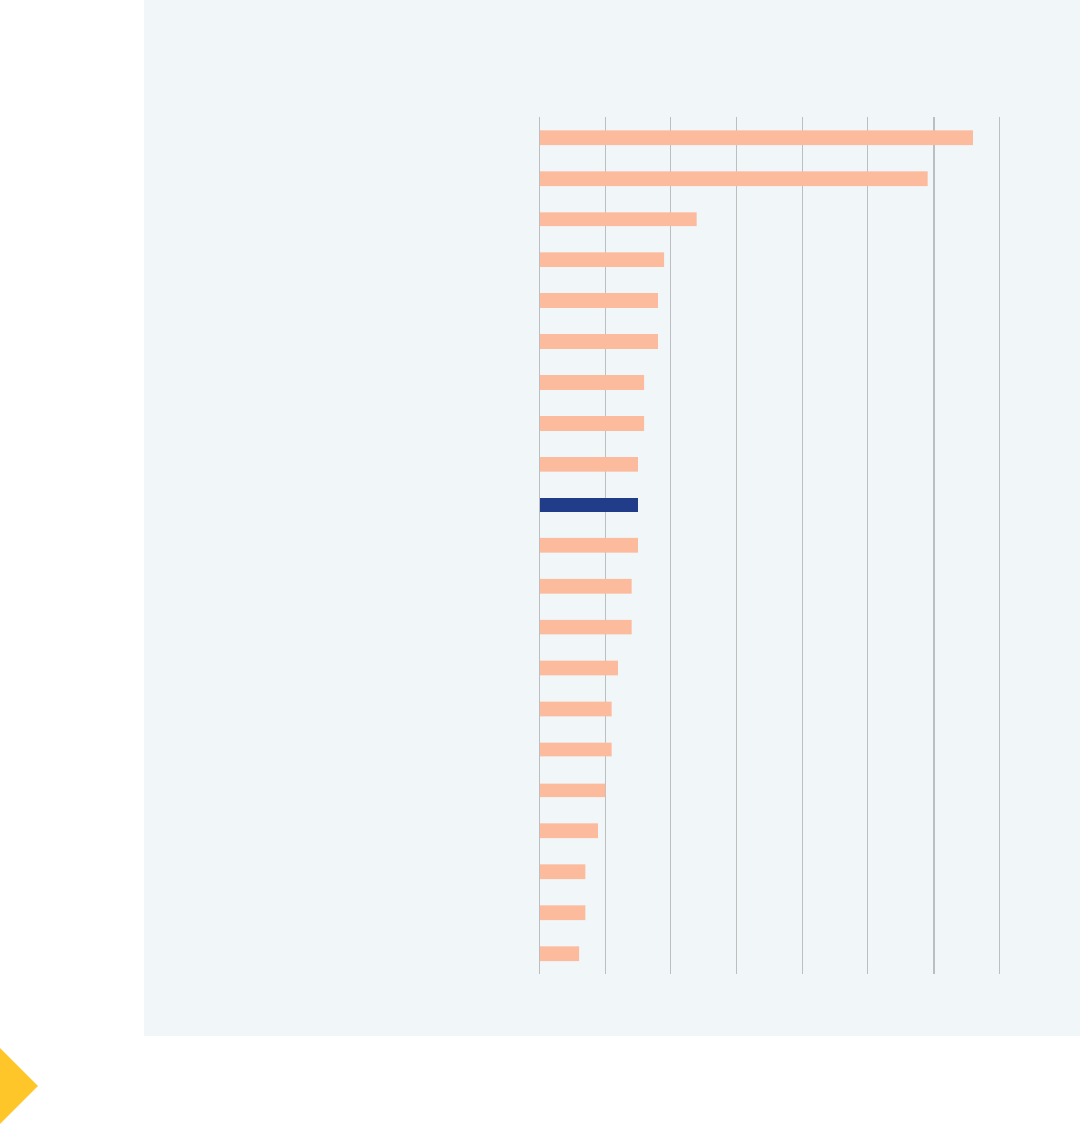
FIGURE 17: Percent of Illinoisans aged 16-64 who reside in non-metro or mixed areas,
by Industry of Employment
Individuals living in rural areas
Individuals in rural communities face compounded challenges — they are more likely to lack broadband inter-
net access due to their geographic location, and this lack of access then hampers their ability to get online
and build better digital skills by participating in educational and workforce opportunities. Tackling these
issues is crucial to ensure an even playing field for individuals in rural areas.
The Census Bureau’s ACS data does not directly tell us whether someone resides in a rural or an urban area.
However, it does provide information on whether someone is located in a metropolitan area, not in a metro
area, or if their approximate location is “on the fence” (i.e., mixed). In Illinois, the mining, quarrying, and oil
and gas extraction, and agriculture, forestry, fishing and hunting industries have disproportionate percent-
ages of workers located in non-metro or mixed areas.
0% 10% 20% 30% 40% 50% 60% 70%
Mining, Quarrying, and Oil and Gas Extraction
Agriculture, Forestry, Fishing and Hunting
Utilities
Public Administration
Manufacturing
Construction
Health Care and Social Assistance
Retail Trade
Wholesale Trade
Illinois Average (all industries)
Educational Services
Other Services (except Public Administration)
Accommodation and Food Services
Transportation and Warehousing
Admin and Support and Waste Management and…
Information
Finance and Insurance
Arts, Entertainment, and Recreation
Management of Companies and Enterprises
Real Estate and Rental and Leasing
Professional, Scientific, and Technical Services
Source: FRB/NSC analysis of 2016-2020 American Community Survey data accessed via IPUMS-USA, University of Minnesota, www.ipums.org
50 CLOSING THE DIGITAL SKILL DIVIDE: THE PAYOFF FOR WORKERS, BUSINESS, AND THE ECONOMY CLOSING THE DIGITAL SKILL DIVIDE: THE PAYOFF FOR WORKERS, BUSINESS, AND THE ECONOMY 51

In addition, 22 percent of American Indian or Alaska Natives (AIAN) in Illinois live in non-metro or mixed
areas, significantly above the 15 percent average for all Illinois residents and the 19 percent average for the
United States. In the industries that disproportionately employ AIAN Illinois residents — mining, quarrying,
and oil and gas extraction and utilities — 66 percent and 24 percent, respectively, of the American Indians
and Alaska Natives in those jobs reside in non-metro or mixed areas.
Individuals who are currently incarcerated
People who are incarcerated (in non-federal institutions) are another “covered population” under the
Digital Equity Act. These individuals face particular challenges in building digital skills while behind bars.
Correctional education programs may restrict or even prohibit the use of digital technology or internet
access, which puts justice-involved people at a disadvantage when reentering society.
The Sentencing Project, a nonprofit organization, found that in Illinois, there are more than 46,000 people
incarcerated in prisons in jails.
39
Black people are imprisoned almost eight times the rate of white people, and
Latinos are imprisoned at 1.5 times the rate of white people. Removing technology and internet restrictions,
and providing meaningful opportunities for incarcerated people to build digital skills, can allow individuals to
prepare effectively for life and employment after release.
40
39 U.S. Criminal Justice Data, The Sentencing Project (2022)
40 Building the Technology Ecosystem for Correctional Education: Brief and Discussion Guide https://lincs.ed.gov/sites/default/files/
tech-ecosystem-correctional-ed.pdf, (U.S. Department of Education, 2022.)
50 CLOSING THE DIGITAL SKILL DIVIDE: THE PAYOFF FOR WORKERS, BUSINESS, AND THE ECONOMY CLOSING THE DIGITAL SKILL DIVIDE: THE PAYOFF FOR WORKERS, BUSINESS, AND THE ECONOMY 51

52 CLOSING THE DIGITAL SKILL DIVIDE: THE PAYOFF FOR WORKERS, BUSINESS, AND THE ECONOMY CLOSING THE DIGITAL SKILL DIVIDE: THE PAYOFF FOR WORKERS, BUSINESS, AND THE ECONOMY 53

METHODOLOGY
T
he data analysis for this report was carried
out as a joint project between the Federal
Reserve Bank of Atlanta and the nonprofit
NSC (hereafter, the research team). The dataset
used was obtained from the labor market informa-
tion company Lightcast, formerly known as Emsi
Burning Glass.
In determining how to assess employers’ demand
for digital skills, the research team first reviewed
other literature on the digitalization of the work-
force (such as this 2017 report from the Brookings
Institution). Ultimately, we did not feel that those
taxonomies would work for our purposes.
The team also considered whether to use the 800+
federal O*NET occupational categories as the
basis for our analysis. In that case, we determined
that the categories were neither fine-grained nor
recently updated enough to serve our purposes.
This decision was informed by qualitative research
conducted by NSC, such as one employer interview
which revealed that the human resources staff had
recently had to add digital skill requirements to their
company’s otherwise O*Net-based job descriptions
to bring them up to date.
Instead, to produce this report, the research team
created our own taxonomy. This is how we did it:
The dataset of 43 million online job postings assem-
bled by Lightcast included information on the par-
ticular skills associated with each job posting. The
typical job ad required applicants to have 8 different
skills. Across all ads, there were 15,000 distinct skills
extracted and standardized by Lightcast.
We sorted the 15,000 Lightcast-labeled skills
in descending order of frequency — that is, the
most-frequently-requested skills at the top. We
then selected the top 50 percent (7,500 skills) and
hand-coded them. Notably, this top 50 percent
covered 99.99 percent of job ads, while the “long
tail” of remaining uncoded skills only covered .01
percent of jobs.
This manual coding formed the basis for the original
analysis and findings in this report. Specifically,
the research team coded each skill across three
domains.
First, the team coded each skill according to
whether it was definitely digital, likely digital, or
not digital.
■
Definitely digital skills were those that pertained
to a named software product, hardware tool, or
category of products, such as Google Docs or
AutoCAD, or otherwise clearly indicated tech-
nology skills, such as social media or computer
literacy.
■
Likely digital skills were tasks such as survey
design or bookkeeping — tasks that today are fre-
quently accomplished with the use of a computer
or other digital device but could still be carried
out in an old-fashioned analog fashion.
■
Not digital skills include manual labor tasks like
changing diapers or ironing.
The second domain on which skills were coded was
whether they required direct or indirect digital
competence. For example, Microsoft Excel requires
direct digital competency since it’s computer soft-
ware. Digital journalism, by contrast, requires digital
skills indirectly — that is, one has to be comfortable
using a computer in order to successfully engage in
digital journalism.
The third and final domain we used was to distin-
guish between general and foundational digital
skills versus those that are more industry specific.
Foundational digital skills are those that require
relatively little training and are used across a wide
range of industries and occupations. These include
basic skills such as typing or data entry as well as
heavily used software programs such as Microsoft
PowerPoint. (While one can of course be a “power
user” of any software product and thus someone
might be using PowerPoint at a very sophisticated
level, our taxonomy is designed to reflect how a
52 CLOSING THE DIGITAL SKILL DIVIDE: THE PAYOFF FOR WORKERS, BUSINESS, AND THE ECONOMY CLOSING THE DIGITAL SKILL DIVIDE: THE PAYOFF FOR WORKERS, BUSINESS, AND THE ECONOMY 53

typical user might use the product.)
In contrast, industry-specific skills generally require
more specialized expertise, such as using electronic
health records, or carrying out Programmable Logic
Controller (PLC) programming.
We are aware that “industry-specific” is a bit
of a misnomer; there are specialized skills that
cross more than one industry, such as Enterprise
Resource Planning (ERP) software, or robotics.
Still, we felt it was particularly important to make
a distinction between foundational skills and other
technology skills. One reason is that there are a host
of curricula, lesson plans, measurement tools, and
other resources meant to hone and measure indi-
viduals’ proficiency with foundational digital skills.
1
But there are far fewer such resources for gauging
competency in industry-specific digital skills.
By ensuring that our analysis broke out these skills
into different categories, we could illustrate the
robust demand for industry-specific skills across
industries and occupational levels. Documenting this
demand helps to illuminate the urgency of devel-
oping new assessments and instructional tools for
these digital skills. This task is of particular impor-
tance given the imminent roll-out of the Digital
Equity Act state formula funding and federal com-
petitive grants, both of which are likely to require
grantees to report on the digital skills gains of their
participants.
To gauge inter-rater reliability, 5 percent of our
total array of skills were coded twice — once each
by different members of the research team. We
were reassured by the strong degree of agreement
evidenced by this process.
ADDITIONAL CODING DECISIONS
The research team made several additional deci-
sions that affected a notable number of skills. For
example, any skill that simply pertained to sub-
ject-matter expertise — which Lightcast usually indi-
cated using the suffix “industry knowledge” — was
considered not digital. The only exceptions were
areas that were clearly technology-related, such as
payment processing industry knowledge.
1 For an overview of such resources, see Digital Resilience
in the American Workforce: Findings from a National
Landscape Scan on Adult Digital Literacy Instruction
(Jobs for the Future, 2022).
Similarly, the numerous medical conditions that
Lightcast codes as skills, such as chicken pox or
hives, were coded as not digital, under the assump-
tion that these appear in job listings when the
applicant is expected to have content-area expertise
about the disease itself.
In general, skills that pertained to knowledge of
specific principles, certain types of experience, and
specific names of legislation were not coded as digi-
tal. Again, there were a handful of exceptions.
WHAT WE LEARNED AS WE WERE
CODING 7,500 SKILLS
When the research team encountered a skill with
which we were unfamiliar, we conducted additional
research to better understand the skill. This included
simple web and job-listings aggregator searches,
consulting with colleagues, and reaching out to peo-
ple we knew who worked in the relevant field. We
were intrigued to find that virtually every time we
consulted a worker about their occupation, the skill
that we were asking about did turn out to be digital.
In general, our instincts were on the conservative
side — that is, skills that we had planned to list as not
digital or likely digital often ended up as definitely
digital after further research and consultation.
We did our utmost to ensure that ambiguous terms
or those with multiple definitions were accurately
coded in our taxonomy. For example, research
revealed that despite its food-themed name,
CocoaPods actually refers to a type of software.
Similarly, although Murex is both a type of financial
software and also a genus of medium to large sized
predatory tropical sea snails, we are confident that
employers were actually seeking the former and not
the latter.
CAVEATS ABOUT THE DATASET
WE USED:
Not all jobs are publicly posted. As a result, the
Lightcast dataset we used is necessarily incomplete.
Some businesses choose to hire informally — that
is, without online postings — because they are
small, because of the nature of their industry, or
because they have gotten better results in the past
from highly localized in-person advertising (e.g.,
literal community bulletin boards) or from private,
paywalled job boards that Lightcast wouldn’t have
54 CLOSING THE DIGITAL SKILL DIVIDE: THE PAYOFF FOR WORKERS, BUSINESS, AND THE ECONOMY CLOSING THE DIGITAL SKILL DIVIDE: THE PAYOFF FOR WORKERS, BUSINESS, AND THE ECONOMY 55

access to.
2
Some job openings are filled through
internal promotion and never posted anywhere. We
do not have sufficient information to know whether
these “invisible” job postings are more or less likely
to require digital skills than those postings that
Lightcast was able to capture.
Not all jobs that actually require digital skills
have updated their job descriptions to indicate
the need for those skills. For example, as part
of earlier research, NSC interviewed staff at one
Fortune 100 company with thousands of workers
across the United States. The interview revealed that
job descriptions are developed locally and are not
standardized across locations, even for the same
occupation. During the pandemic, as frontline jobs
quickly changed to require more digital skills, short-
handed plant managers did not necessarily update
their job postings.
Similarly, another business had assumed its truck
drivers possessed baseline digital skills and had not
bothered to specify them in their job descriptions.
But when the company transitioned to an app-based
payroll system, supervisors unexpectedly had to
spend enormous amounts of time providing individ-
ualized tech support to drivers who had never used
this type of mobile tool and were not equipped to
accurately report their hours for legal and payment
purposes.
In both cases, the Lightcast data we used for this
study would not have captured the newly required
digital skills, because the relevant employer would
not have included them in their online job posting.
For this reason, we believe that the Lightcast data
is, if anything, an undercount of digital skill require-
ments in job openings today.
Not all “skills” are skills. Lightcast’s process for
scraping job postings and standardizing the qual-
ifications listed in the postings into broad “skill”
categories is imperfect. The research team observed
how this shows up in the data when we noticed that
“animal dander” was showing up as a skill. A review
of common job listings on sites such as Indeed and
LinkedIn quickly revealed that not being allergic to
animal dander is a commonly listed requirement for
a variety of laboratory, veterinary office, and zoo
2 For example, one such site in the Washington D.C. area is
www.traversejobs.com/
jobs. Obviously, this is not a skill in the sense that a
person can learn or develop it.
We are satisfied that our own manual coding of
skills eliminated most of this noise in the data.
However, we acknowledge that there are a few items
that were impossible to disentangle. For example,
“mobile phones” in a job listing often indicates sub-
ject-area knowledge or technical expertise that a job
applicant must have, but in other cases may reflect
the employer’s requirement that applicants have
their own mobile phone in order to do the job.
Lightcast’s skill groups vary significantly in
granularity. The aggregation decisions made by
Lightcast before releasing the data to the public
are inevitably to some degree mysterious and
arbitrary. We noted that for some industries, such
as IT, there were a plethora of highly specific skills,
including brand names of specific software prod-
ucts, all reported as individual skill types. In con-
trast, for other fields such as law and science, huge
umbrella terms such as litigation or geology often
showed up. We suspect that this may have led to
an under-counting of digital skills, or at least to a
classification of some items as likely digital that in
reality might fit better under definitely digital. Given
that there was no practical way for us to re-code the
underlying 43 million job postings, we are satisfied
that we did the best we could.
Data on business size is inferred. As noted in the
main report, Lightcast does not directly catego-
rize job ads based on the size of the company that
posted them. Instead, the data show the number
of job ads posted per year for a given company.
We inferred from that data that companies posting
between one and fifty job ads per year are on aver-
age smaller businesses than companies posting, for
example, 500 or more ads per year. The research
team recognizes that this isn’t a perfect proxy and
that there are outliers out there.
The team also recognizes this method up-ranks high
growth, high turnover labor intensive firms; and
down-ranks highly productive firms with a smaller
workforce; and firms with lower rates of turnover.
However, we find this method generally aligns with
revenue- and employee-size-based definitions of
business size.
54 CLOSING THE DIGITAL SKILL DIVIDE: THE PAYOFF FOR WORKERS, BUSINESS, AND THE ECONOMY CLOSING THE DIGITAL SKILL DIVIDE: THE PAYOFF FOR WORKERS, BUSINESS, AND THE ECONOMY 55