Title stata.com
graph twoway qfit — Twoway quadratic prediction plots
Syntax Menu Description Options
Remarks and examples Also see
Syntax
twoway qfit yvar xvar
if
in
weight
, options
options Description
range(# #) range over which predictions calculated
n(#) number of prediction points
atobs calculate predictions at xvar
estopts(regress options) options for regress
predopts(predict options) options for predict
cline options change look of predicted line
axis choice options associate plot with alternative axis
twoway options titles, legends, axes, added lines and text, by, regions, name,
aspect ratio, etc.
See [G-3] cline options, [G-3] axis choice options, and [G-3] twoway options.
All options are rightmost; see [G-4] concept: repeated options.
yvar and xvar may contain time-series operators; see [U] 11.4.4 Time-series varlists.
aweights, fweights, and pweights are allowed. Weights, if specified, affect estimation but not how
the weighted results are plotted. See [U] 11.1.6 weight.
Menu
Graphics > Twoway graph (scatter, line, etc.)
Description
twoway qfit calculates the prediction for yvar from a linear regression of yvar on xvar and xvar
2
and plots the resulting curve.
Options
range(# #) specifies the x range over which predictions are calculated. The default is range(. .),
meaning the minimum and maximum values of xvar. range(0 10) would make the range 0 to
10, range(. 10) would make the range the minimum to 10, and range(0 .) would make the
range 0 to the maximum.
1

2 graph twoway qfit — Twoway quadratic prediction plots
n(#) specifies the number of points at which predictions over range() are to be calculated. The
default is n(100).
atobs is an alternative to n(). It specifies that the predictions be calculated at the xvar values. atobs
is the default if predopts() is specified and any statistic other than xb is requested.
estopts(regress options) specifies options to be passed along to regress to estimate the linear
regression from which the curve will be predicted; see [R] regress. If this option is specified,
commonly specified is estopts(nocons).
predopts(predict
options) specifies options to be passed along to predict to obtain the predictions
after estimation by regress; see [R] regress postestimation.
cline options specify how the prediction line is rendered; see [G-3] cline options.
axis choice options associate the plot with a particular y or x axis on the graph; see
[G-3] axis choice options.
twoway options are a set of common options supported by all twoway graphs. These options allow
you to title graphs, name graphs, control axes and legends, add lines and text, set aspect ratios,
create graphs over by() groups, and change some advanced settings. See [G-3] twoway options.
Remarks and examples stata.com
Remarks are presented under the following headings:
Typical use
Cautions
Use with by( )
Typical use
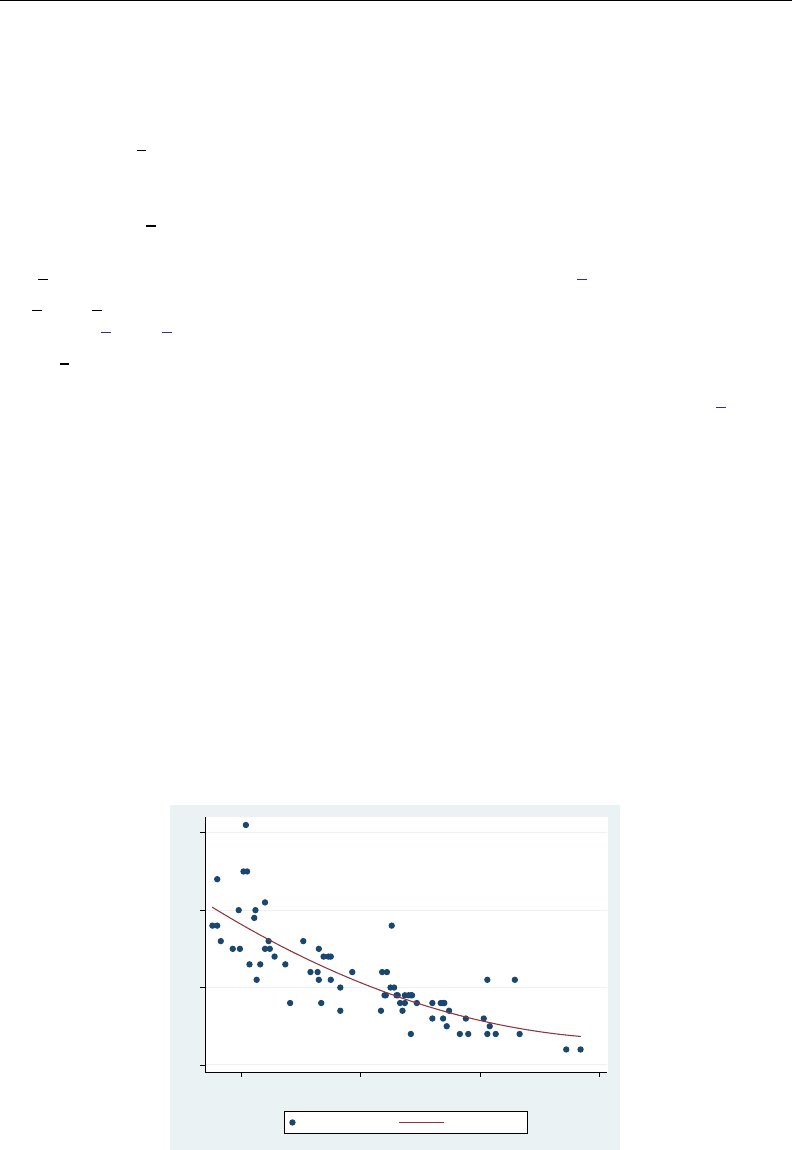
twoway qfit is nearly always used in conjunction with other twoway plottypes, such as
. use http://www.stata-press.com/data/r13/auto
(1978 Automobile Data)
. scatter mpg weight || qfit mpg weight
10 20 30 40
2,000 3,000 4,000 5,000
Weight (lbs.)
Mileage (mpg) Fitted values

graph twoway qfit — Twoway quadratic prediction plots 3
Results are visually the same as typing
. generate tempvar = weight^2
. regress mpg weight tempvar
. predict fitted
. scatter mpg weight || line fitted weight
Cautions
Do not use twoway qfit when specifying the axis scale options
yscale(log) or xscale(log) to create log scales. Typing
. scatter mpg weight, xscale(log) || qfit mpg weight
produces something that is not a parabola because the regression estimated for the prediction was for
mpg on weight and weight^2, not mpg on log(weight) and log(weight)^2.
Use with by( )
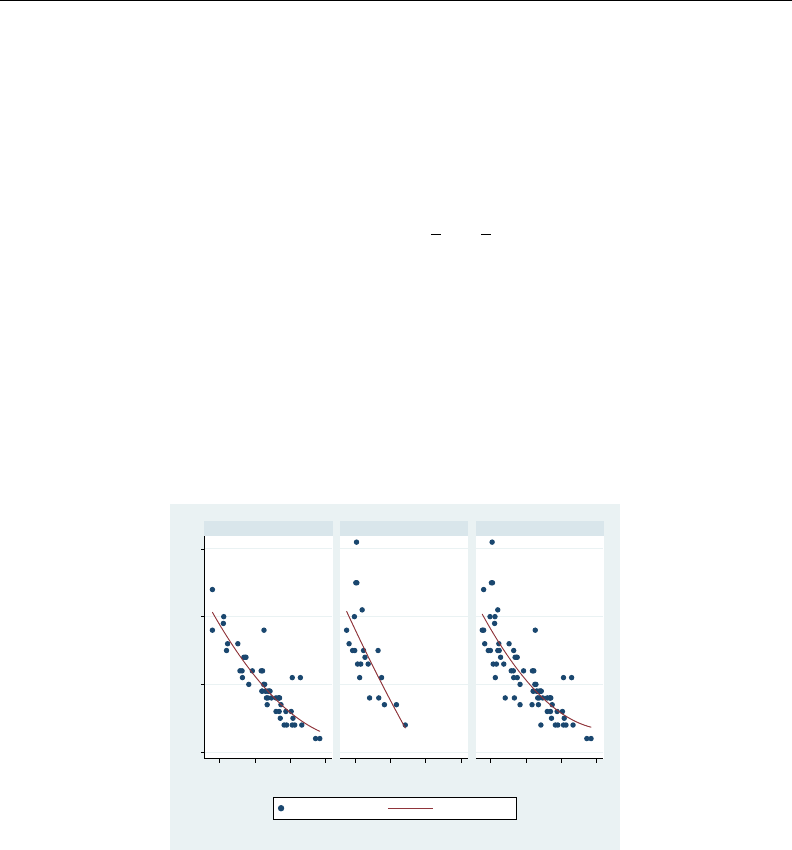
qfit may be used with by() (as can all the twoway plot commands):
. scatter mpg weight || qfit mpg weight ||, by(foreign, total row(1))
10 20 30 40
2,000 3,000 4,000 5,000 2,000 3,000 4,000 5,000 2,000 3,000 4,000 5,000
Domestic Foreign Total
Mileage (mpg) Fitted values
Weight (lbs.)
Graphs by Car type
Also see
[G-2] graph twoway line — Twoway line plots
[G-2] graph twoway lfit — Twoway linear prediction plots
[G-2] graph twoway fpfit — Twoway fractional-polynomial prediction plots
[G-2] graph twoway mband — Twoway median-band plots
[G-2] graph twoway mspline — Twoway median-spline plots
[G-2] graph twoway qfitci — Twoway quadratic prediction plots with CIs
[R] regress — Linear regression
